You should know OpenTelemetry - As a frontend engineer
You should know OTEL as a frontend engineer - observability is not optional

Observability is not optional. Chances are you're on-call for your team right now. And as a frontend dev, you're most likely using Sentry, New Relic, Datadog, or some other paid SaaS.
The thing is, it doesn't matter which product—your team needs visibility into your systems. Maybe orders aren't going through, or users can't add products to the cart—it can be anything.
You set alerts, check the metrics at regular intervals, and if something does go wrong, you have data to rely on to quickly reach a conclusion. The truth is, all the third-party tools I mentioned above make this too easy. They have fancy dashboards, a super intuitive query language (I'm looking at you, NRQL), or some other fancy tooling, and they're not cheap.
Your organization might decide to cut costs on third-party tooling and run everything in-house. It is certainly possible, very much so actually. One solution is OpenTelemetry.
What is OpenTelemetry?
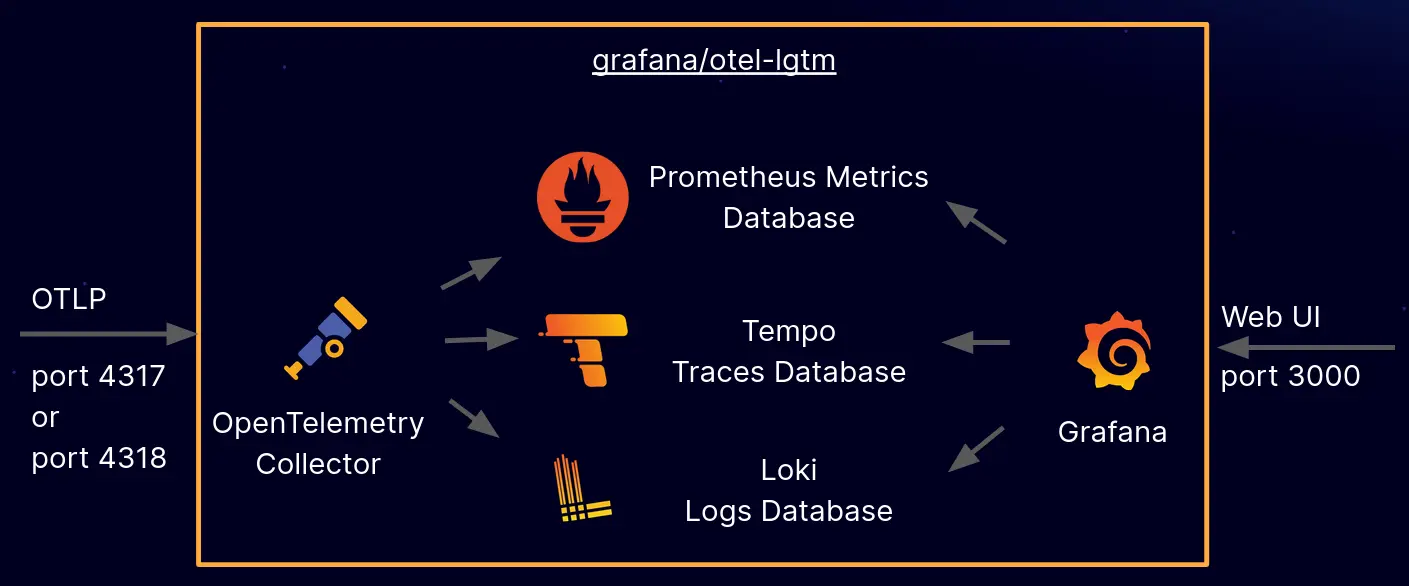
OpenTelemetry is an open-source framework that provides a vendor-neutral standard for generating, collecting, processing, and exporting observability data (logs, metrics, traces) from cloud-native apps. Think of it as unified "plumbing" to understand system behavior without being locked into a specific monitoring tool.
Migrating from a paid SaaS tool to an in-house observability stack can be daunting, to say the least. Most of the leg work is probably done by your DevOps team in making sure your metrics, traces, and logs keep flowing (kudos to them).
Every service in your stack needs to migrate to your in-house observability solution. Fortunately, OpenTelemetry provides robust and battle-tested SDKs to collect telemetry data with very little effort. Most frameworks maintain their own SDKs, which makes it a straightforward to integrate within their system.
Things change when you're a frontend dev. Chances are you never actually had to deal with all these things. It can be daunting at first, understanding just how many layers you overlooked when a third-party SaaS did the job for you, instrumenting each layer of your application.
OTEL defines three core signals that describe how your system behaves:
- Traces
- Metrics
- Logs
Traces
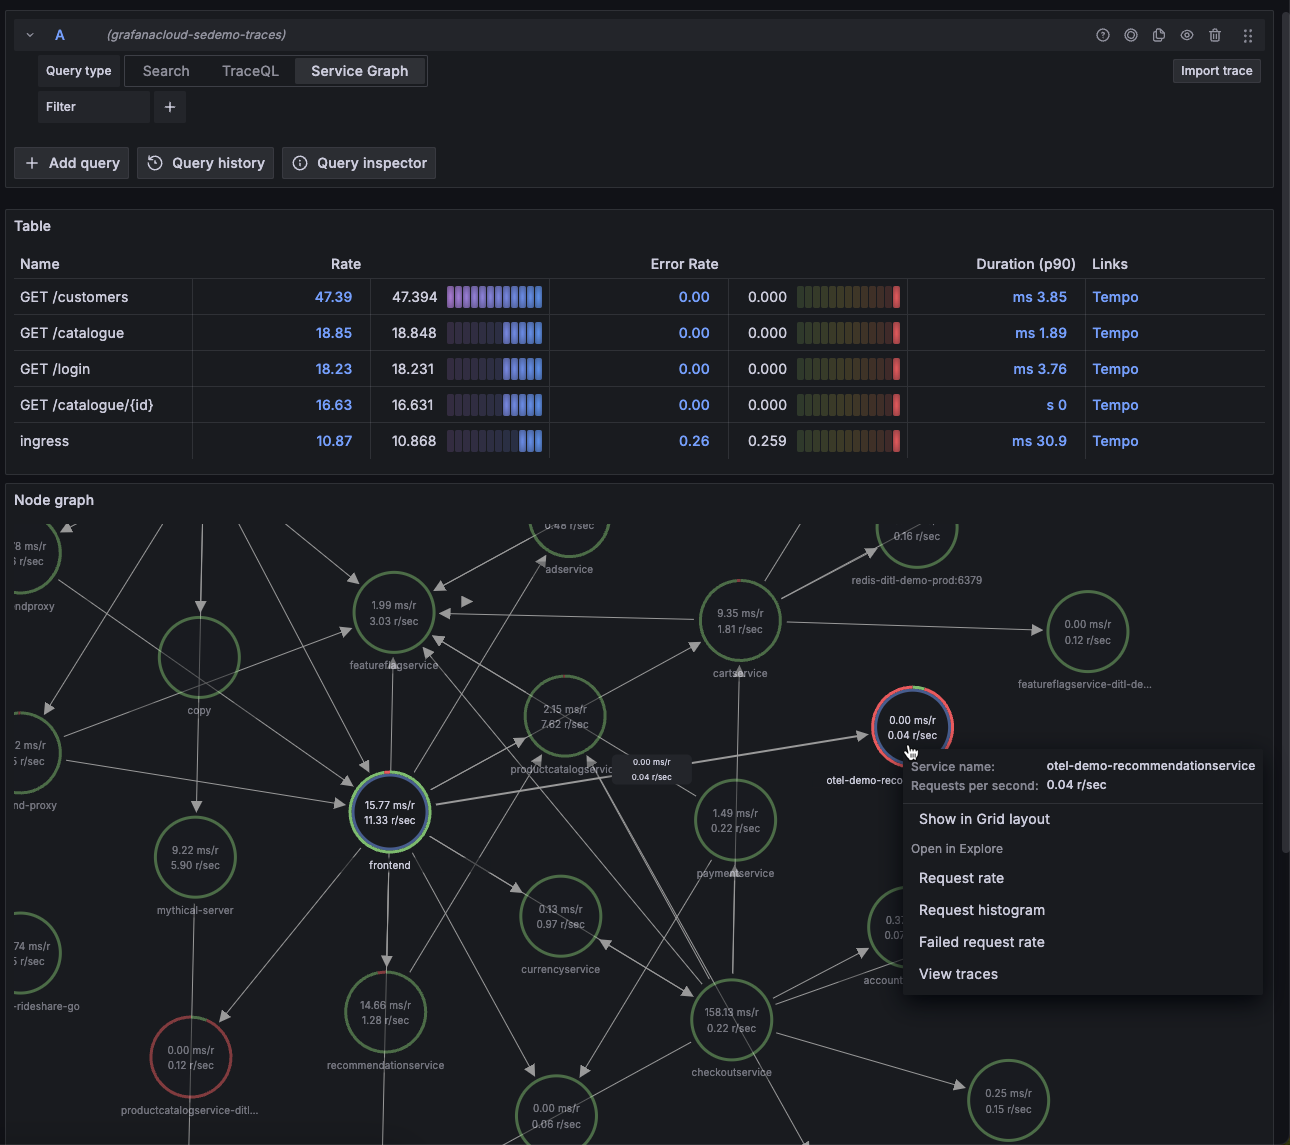
Think of traces like the journey of a request throughout your system. Each part of this journey is called a span. A span contains context about the request at a given time—including the time it took for the request to complete that specific task, context about where the request went, where it came from, status code and other HTTP attributes, along with any custom attribute you want to attach. Spans together make up a trace, giving you a complete picture of where the request traveled from point A to point B.
Your infra probably uses Jaeger to visualize these traces, or it could just be Grafana using Tempo (more on this in another post).
Metrics
Metrics tell you how your application is performing at any given point. Some examples would be application latency, error rates, and application throughput in a given time interval. They can be represented as a time-series graph to visualize and form patterns. Metrics are typically pushed by your applications at regular time intervals to a metrics database like Mimir. Mimir can take this data and store it.
Visualization tools like Grafana can then easily query this data and plot it for you. This gives you instant, top-level visibility into your system.
Logs
Probably the easiest one to understand. Logs are output streams emitted by your application, which are then captured by a log scraping tool like Promtail and Loki.
Promtail (although now in maintenance mode, replaced by Alloy) captures output streams from your application and sends them to Loki. Loki can then store this data in a structured format, which makes it easier to query.
And yet again, Grafana can then help you query your logs with ease.
But how do we set this up—and why should I care about this as a frontend dev?
We can divide instrumenting a frontend application into two parts:
- Browser Monitoring
- Server Side Monitoring
Browser Monitoring
Everything from core web vitals to instrumenting requests from your browser to track error rates, metrics, and traces as explained above.
OTEL exposes browser monitoring SDKs for you to integrate with your application, which you can use to control what data to instrument and send to your exporters.
Exporters are where your traces and metrics end up—basically the services that process them.
One popular example is Grafana Faro, which does all the heavy lifting for you. It wraps OTEL SDKs underneath and helps you export the majority of data you'd need to visualize your application. You can even send any custom metrics you want with Faro—including custom errors or just plain logs—which will then end up as logs in your dashboard.
Side Note: Logs and metrics are two completely different types of data. Metrics are data points plotted over a time period, while logs are information emitted by your application at a given time. However, your DevOps team can help you convert logs into metrics using custom recording rules.
Grafana Faro includes core web vitals, giving you a route-by-route picture of your application's client performance (read my last post about real user monitoring). You get metrics about error rates, application latency, logs emitted by your client application (including errors and network failures), and more.
You can use metrics to set up alerts that notify you as soon as something goes wrong, similar to what the third-party tools were doing for you. You can use traces to take a look at how your APIs are performing and how they behave when they call downstream services to get a complete picture.
Most of this holds true until you reach the server side—especially if you're using a modern SSR framework like Next.js. And this is where things get unexpectedly tricky.
Server Side Monitoring
Chances are you're using a server-side rendering framework. If yes, your work just doubled. Your server health and visibility is equally, if not more, important than your client health.
You need the same layers of visibility into your frontend server as your client application. The difference here is the SDKs and tools we use to instrument the performance on the server side of things. Chances are you're running Node—at least this is what Next.js does for you.
My issue with OTEL and Next.js
The craziest part of the migration was the fact that OTEL does not completely support Next.js. It just completely blew my mind how a massively adopted framework like Next has limited support from the most famous telemetry backend.
I'll make this short. Next.js does not tell OTEL the route (http.route) for which the metrics are being recorded. Other Node frameworks like Express or Fastify either have their own wrappers over OTEL, or they patch the SDKs such that this attribute is readily available for them.
But not for Next.js, no sir. What does this mean though? This means by default, you have no route-level visibility into your server. Which routes are failing? Which routes have the highest throughput? We just don't know. There are several open issues on OTEL which are yet to be picked up.
This happens because Next.js does not tell OTEL the route attribute to instrument. (@vercel/otel mostly focuses on traces, not on metrics.)
No shade to OTEL here—I think it's an awesome project, without which a large chunk of observability on the internet wouldn't exist.
How did I solve this?
Solving this was quite a challenge, but not too complex once I figured out how these SDKs work. I had to instrument each incoming and outgoing request on my server manually using OpenTelemetry's NodeSDK.
NodeSDK provides hooks for us to attach our own callbacks during different phases of a request-response cycle, like onRequest and onResponse, during which we can record our own custom metrics.
But how does that solve the route problem? For each incoming request and response callback, we do get the request and response objects, using which we can identify where the incoming and outgoing requests are heading to/from.
Using this information, we can run our own route normalization logic to convert a route like /product/123 to /product/:id. We then attach this data to the outgoing metric.
Why the route normalization?
One limitation of OTEL is the cardinality of metrics—too many unique values for the same attribute can cause performance issues and make your metrics database explode in size. With dynamic routes, we need to make sure we normalize our routes to reduce the cardinality as much as possible.
Here's an example of custom instrumentation using OTEL's NodeSDK:
requestHook: (span: Span, request: ClientRequest | IncomingMessage) => {
    const isIncoming = 'httpVersion' in request;

    if (isIncoming) {
      const incomingMessage = request as IncomingMessage;
      const url = incomingMessage.url ?? '/';
      const route = normalizeServerRoute(url);

      // ONLY set http.route - this is the critical attribute for metrics
      span.setAttribute(ATTR_HTTP_ROUTE, route);

    } else {
      // Outgoing request - capture start time for duration tracking
      const clientRequest = request as ClientRequest;
      clientRequest._otelStartTime = process.hrtime();
    }
  },

  /**
   * Called when response is sent/received.
   * This is where we record ALL metrics - we now have complete information.
   */

  responseHook: (span: Span, response: IncomingMessage | ServerResponse) => {
    const isServerResponse = 'writeHead' in response;

    if (isServerResponse) {
      // SERVER RESPONSE: We're sending a response to a client
      const serverResponse = response as ServerResponse;
      const incomingMessage = (serverResponse as unknown as { req?: IncomingMessage }).req;

      if (!incomingMessage) return;

      const method = incomingMessage.method ?? 'GET';
      const url = incomingMessage.url ?? '/';
      const route = normalizeServerRoute(url);
      const statusCode = serverResponse.statusCode;
      const startTime = incomingMessage._otelStartTime;

      // Decrement active requests
      if (metricsObj.serverActiveRequests) {
        metricsObj.serverActiveRequests.add(-1, {
          [ATTR_HTTP_REQUEST_METHOD]: method,
          [ATTR_HTTP_ROUTE]: route,
        });
      }

      // Record duration histogram in milliseconds
      // Note: Histogram automatically tracks count and sum
      if (startTime && metricsObj.serverRequestDuration) {
        const diff = process.hrtime(startTime);
        const durationMs = (diff[0] * 1e9 + diff[1]) / 1e6; // Convert to milliseconds

        metricsObj.serverRequestDuration.record(durationMs, {
          [ATTR_HTTP_REQUEST_METHOD]: method,
          [ATTR_HTTP_ROUTE]: route,
          [ATTR_HTTP_RESPONSE_STATUS_CODE]: statusCode,
        });
      }
    } else {
      // CLIENT RESPONSE: We received a response from another service (http/https module)
      // Don't modify span - OTEL handles it. Only record metrics.
      const clientResponse = response as IncomingMessage;
      const statusCode = clientResponse.statusCode ?? 0;

      const req = (clientResponse as unknown as { req?: ClientRequest }).req;
      const url = (req as unknown as { path?: string })?.path ?? '/';
      const route = normalizeClientRoute(url);
      const method = (req as unknown as { method?: string })?.method ?? 'GET';
      const host =
        clientResponse.headers?.host ?? (req as unknown as { host?: string })?.host ?? 'unknown';
      const startTime = req?._otelStartTime;

      // Record duration histogram in milliseconds
      // Note: Histogram automatically tracks count and sum
      if (startTime && metricsObj.clientRequestDuration) {
        const diff = process.hrtime(startTime);
        const durationMs = (diff[0] * 1e9 + diff[1]) / 1e6; // Convert to milliseconds

        metricsObj.clientRequestDuration.record(durationMs, {
          [ATTR_HTTP_REQUEST_METHOD]: method,
          [ATTR_SERVER_ADDRESS]: String(host),
          [ATTR_HTTP_ROUTE]: route,
          [ATTR_HTTP_RESPONSE_STATUS_CODE]: statusCode,
        });
      }
    }
  }
Back to the topic at hand—once you instrument your client and server, you can safely set limits and alerts, allowing you full control and visibility into your system.
Querying your data
You started recording data, but how do I start querying it? At the start of this article, I mentioned that third-party tools often offer intuitive querying languages. Depending on where your team decides to store the data, you can have multiple options on how to query it. One of the most famous examples is PromQL, also known as the Prometheus Query Language.
Example:
rate(http_server_duration_milliseconds_count{
    http_status='400',
    http_route=~'/api/v3/order',
    service_name='my-web-app'
    }[5m])
Let's break this down:
Here, we're querying for the rate of requests with status code 400, which matches the route /api/v3/order pattern from the my-web-app service in a 5-minute interval. The rate() function calculates how fast the counter is increasing per second, and [5m] tells it to look back 5 minutes to calculate that rate.
This is similar to what you'd use in a real-life scenario to debug on-call issues. You could set up an alert that triggers when this rate exceeds a certain threshold, giving you immediate visibility into failing requests.
For full reference: Visit
Closing Notes
A lot of knowledge in this blog post is something I wanted to document for my future self. What you can take away from this read is that it makes you a more complete engineer if you have top-to-bottom visibility of your system and can peek through the gaps if necessary.
I encourage you to set up your systems and try to implement these tools to better understand them. The learning curve is steep, but the payoff in understanding how your applications truly behave in production is worth it.