We Don't Care About Lighthouse Scores Anymore
We Don't Care About Lighthouse Scores Anymore - But We Obsess Over Real User Data
As frontend engineers, when your company asks you to improve website performance, where do you look? Most of us end up at the same place: Lighthouse. You fire up the console, run a quick test, and get some metrics. But what do they actually tell you about your users' experience?
I can't stress enough how important UX and performance matter at scale. Everything from SEO to user retention hangs in the balance if you cannot deliver a snappy experience. But here's the thing: Lighthouse scores are just a guardrail, not a goal.
Let's talk about what actually matters.
Understanding the Metrics (Quick Primer)
Before we dive in, let's quickly define what we're measuring:
Largest Contentful Paint (LCP)
Defines how soon the largest element on your page is visible. The acceptable values range between 0 to 4s, and a good score should be below 2.5s.
First Contentful Paint (FCP)
Defines how soon the first element on your page is visible. The acceptable values range between 0 to 3s, and a good score should be below 1.8s.
Interaction to Next Paint (INP)
Defines how soon a user is able to interact with your application. Imagine this: you server-render your web page, but it needs time to download the Javascript, parse and hydrate.
All of this depends on how large your bundles are, what caching strategies you use, and the amount of time it takes to parse your code.
Cumulative Layout Shift (CLS)
From web.dev:
CLS is a measure of the largest burst of layout shift scores for every unexpected layout shift that occurs during the entire lifecycle of a page.
A layout shift occurs any time a visible element changes its position from one rendered frame to the next.
A burst of layout shifts, known as a session window, is when one or more individual layout shifts occur in rapid succession with less than 1-second in between each shift and a maximum of 5 seconds for the total window duration.
The web.dev docs cover additional metrics and optimization strategies in depth.
The Problem with Synthetic Testing
Chances are, you and your colleagues are convinced that improving these Lighthouse numbers is your best bet to driving revenue and getting people talking about your product. I wish it was that easy.
The truth is, lighthouse scores are just a very small piece of a very big puzzle. As engineers, data is our friend. Numbers don't lie. But in this case, they kind of do.
Here's why: In a country like India, people use mobile devices ranging from a small 5k device to a flagship 80k iPhone. The metrics you see on your machine are largely a result of tests throttling the CPU and network conditions to simulate a number of environments.
Are these numbers accurate enough for you to declare what your users are feeling when they interact with your site? No.
At Zepto, Lighthouse showed our checkout flow scoring 95+, but real user data revealed users on 3G networks were seeing 6s+ load times—something our throttled tests completely missed.
Real User Monitoring (RUM)
You need real data, straight from the devices of users accessing your website on a 3G network, with variable bandwidth conditions, tricky hardware, limited memory availability, etc.
There are a number of ways to get this data:
Option 1: Web Vitals Library
Using Google's web-vitals library and running it on the user device.
This can get tricky—by using a library you're shipping extra javascript to the user. Here's a minimal implementation:
import { onCLS, onFCP, onLCP, onINP } from 'web-vitals';

function sendToAnalytics(metric) {
  // Send to your analytics endpoint
  fetch('/analytics', {
    method: 'POST',
    body: JSON.stringify({
      name: metric.name,
      value: metric.value,
      id: metric.id,
      // Include useful context
      connection: navigator.connection?.effectiveType,
      deviceMemory: navigator.deviceMemory,
    }),
  });
}

// Measure core web vitals
onCLS(sendToAnalytics);
onFCP(sendToAnalytics);
onLCP(sendToAnalytics);
onINP(sendToAnalytics);
The web-vitals library is only ~3KB gzipped, and you can tree-shake to include only the metrics you need.
Option 2: Monitoring SDKs
Some monitoring SDKs like Sentry, New Relic, and Grafana Faro handle these use cases with ease, along with other capabilities like monitoring and observability.
Cost and complexity considerations: These tools range from free tiers (suitable for smaller teams) to enterprise pricing. Start simple—even basic RUM is better than none.
Option 3: Chrome User Experience Report (CRUX)
Chances are you're using one of the tools above. If not, you're in luck. Google provides Chrome User Experience Report (CRUX) data for all Chrome users.
And let's be real, everyone is using Chrome one way or another. These metrics are the most accurate numbers you can possibly get—and they're free.
Real World Example: Amazon
Let's take Amazon for example.
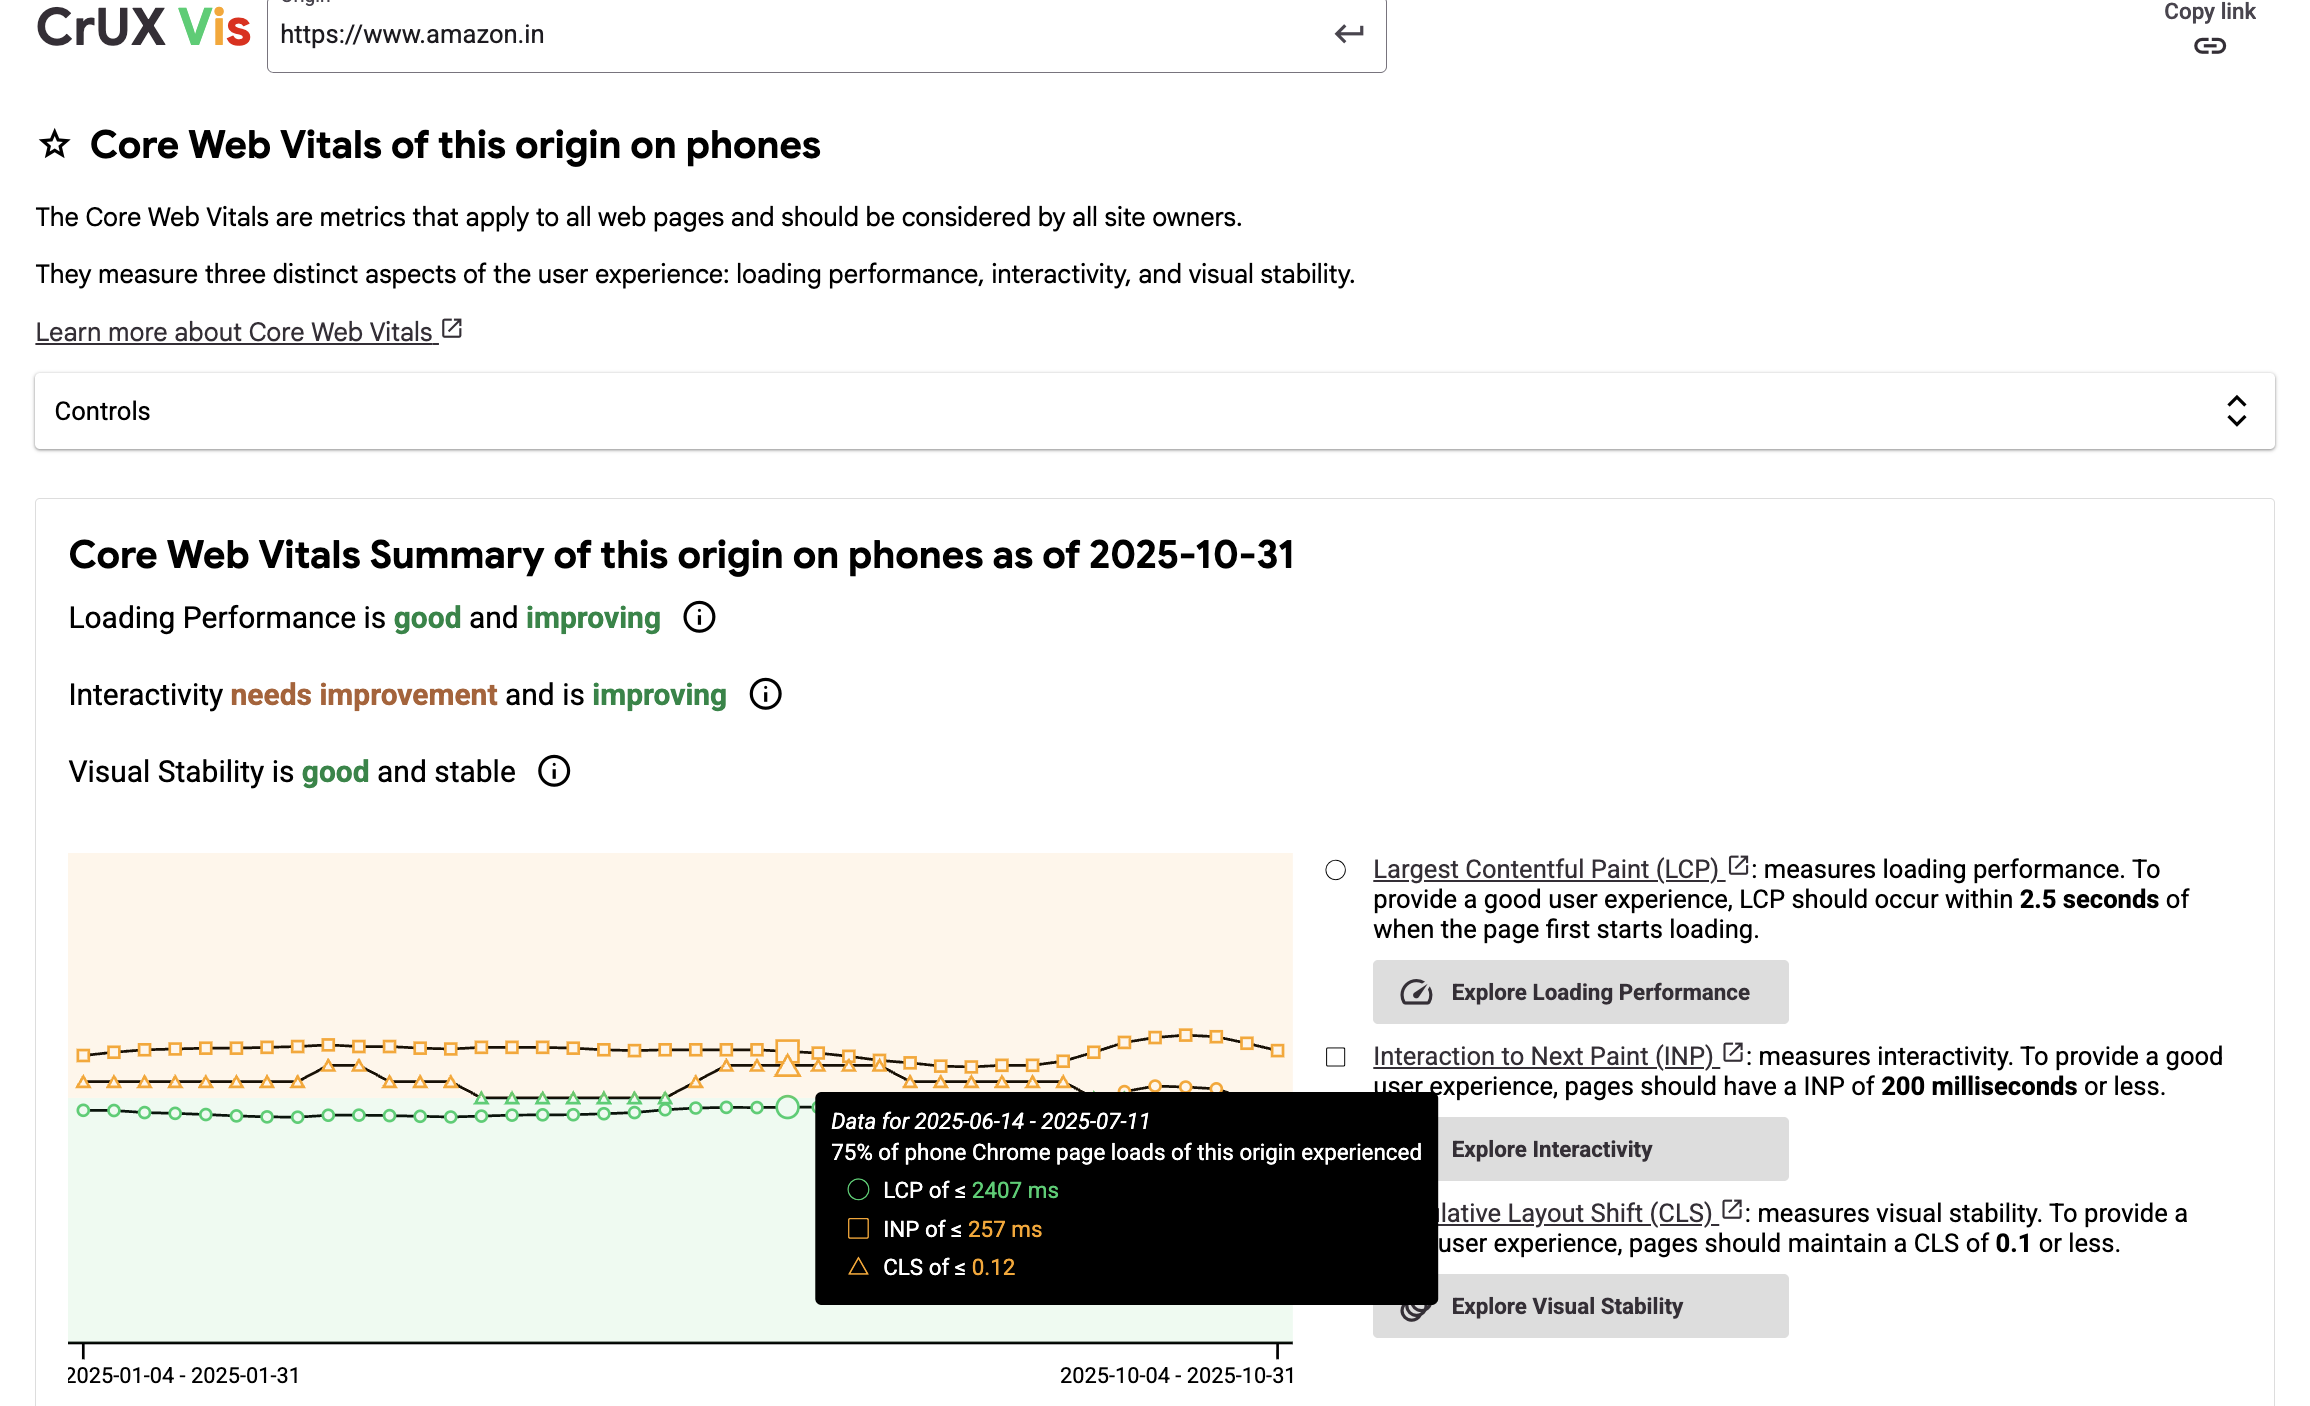
You can see historical data for a number of data points: CLS, FCP and LCP. These numbers are straight from users' real devices. Notice how Amazon's p75 CLS hovers around 0.12s on mobile—significantly worse than their synthetic scores would suggest.
Using these numbers, your team can decide what to drill down on. Maybe your LCP is too high. You probably need to cut down how much JS you're shipping to your users, optimize images, CSS and the whole shebang.
From Metrics to Money
Here's where it gets interesting. Flipkart found that every 100ms reduction in LCP led to a 1% increase in conversion (source: Google I/O '24).
Let's do the math: For a ₹1000 Cr GMV site, that's ₹10 Cr/year from a 100ms improvement. Multiply that across multiple optimizations, and you're looking at real business impact.
Lighthouse won't tell you that—your analytics + RUM will.
This is why RUM matters. It connects technical metrics to business outcomes. Your Lighthouse score doesn't know your conversion rate. Your RUM data combined with analytics does.
When Lighthouse IS Useful
Don't get me wrong—Lighthouse still has its place:
- Catching regressions in PRs: Automated checks prevent performance degradation from being merged
- Debugging specific issues: Controlled environments help isolate problems
- Comparing implementations: A/B testing different technical approaches
- Setting baseline expectations: Ensuring code meets minimum standards
The key is using Lighthouse as a guardrail, not a goal. A perfect Lighthouse score means nothing if your real users are suffering.
Setting Up Lighthouse CI for PR Comments
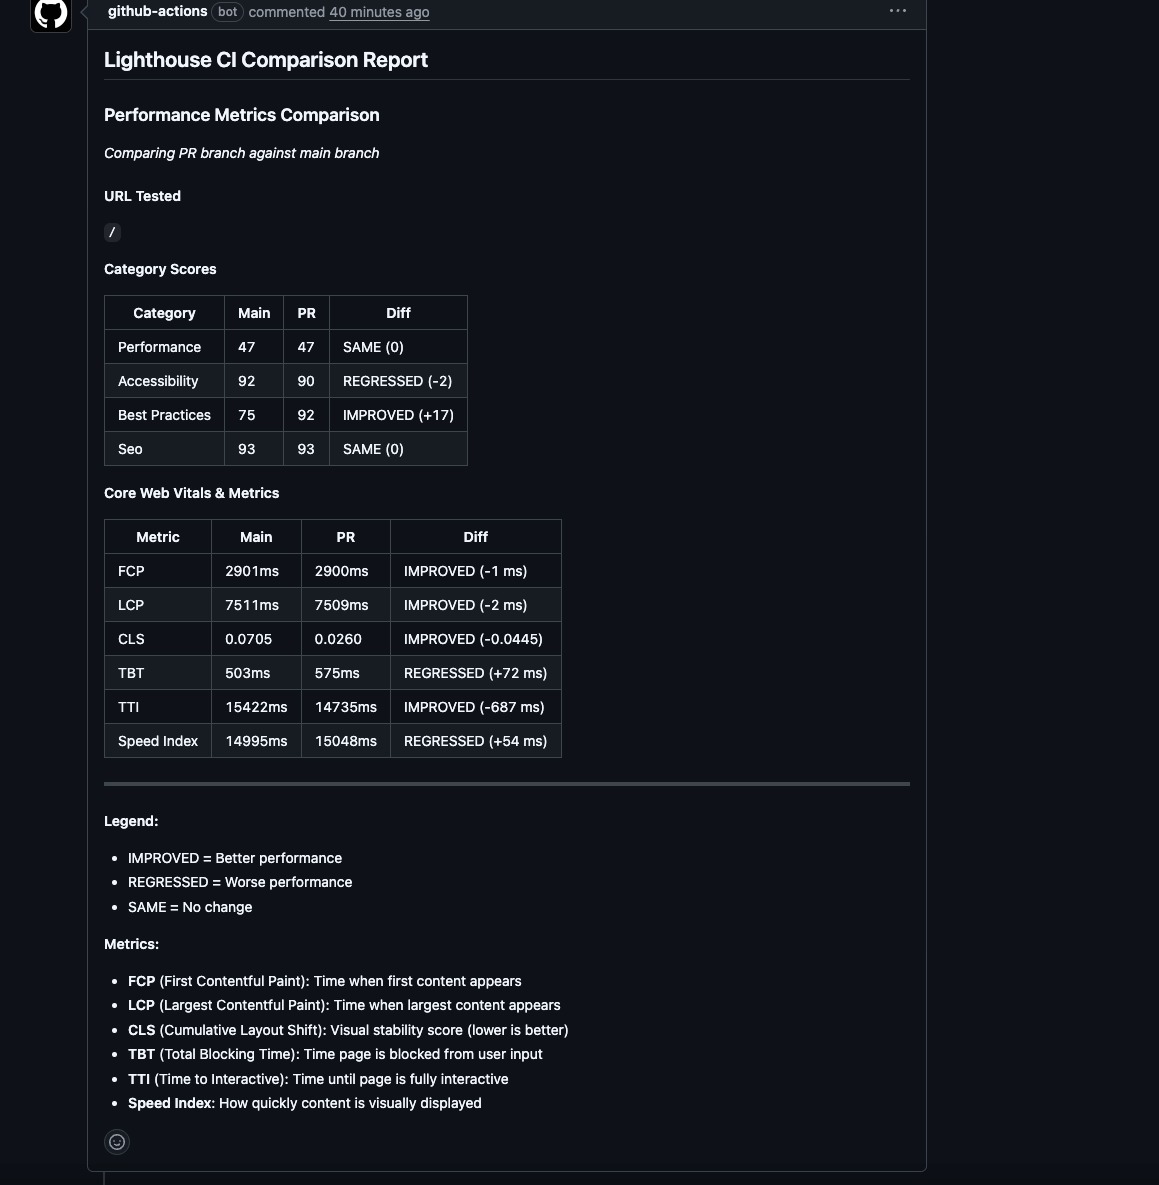
Want to add Lighthouse checks to your PRs? Lighthouse CI is an open-source tool that runs Lighthouse tests and posts results directly to your pull requests.
Basic setup:
# .github/workflows/lighthouse-ci.yml
name: Lighthouse CI
on: [pull_request]

jobs:
  lighthouse:
    runs-on: ubuntu-latest
    steps:
      - uses: actions/checkout@v3
      - name: Run Lighthouse CI
        uses: treosh/lighthouse-ci-action@v9
        with:
          urls: |
            https://your-preview-url.com
          uploadArtifacts: true
          temporaryPublicStorage: true
This gives you automated performance feedback on every PR—but remember, these are still synthetic scores. Use them to catch regressions, not as your north star.
Making Informed Decisions
It is important to have visibility and accountability for what you are shipping. Maybe you deploy twice a week, or daily. You can never know what might affect the quality you deliver.
It is important to have guardrails and observability in your systems. At Zepto, we recently started running Lighthouse tests on every pull request, blocking the PR if scores fall below a defined threshold. These numbers aren't perfectly accurate, as described above, but they give developers accountability by running tests in a controlled environment.
Another thing we've done is to automate CRUX weekly reports and send them to a common Slack channel. This gives us a weekly picture of what's going on with our users. We can then swiftly prioritize our efforts towards things that matter.
Setting Up Automated CRUX Reports
You can use the CrUX API to fetch real user data and send weekly summaries to Slack. Here's a basic setup:
// crux-weekly-report.js
const CRUX_API_KEY = process.env.CRUX_API_KEY;
const SLACK_WEBHOOK = process.env.SLACK_WEBHOOK_URL;

async function getCruxData(origin) {
  const response = await fetch(
    `https://chromeuxreport.googleapis.com/v1/records:queryRecord?key=${CRUX_API_KEY}`,
    {
      method: 'POST',
      headers: { 'Content-Type': 'application/json' },
      body: JSON.stringify({
        origin: origin,
        formFactor: 'PHONE', // PHONE, DESKTOP, or TABLET
      }),
    }
  );
  return response.json();
}

async function sendSlackReport(data) {
  const metrics = data.record.metrics;

  const message = {
    text: '📊 Weekly CrUX Report',
    blocks: [
      {
        type: 'header',
        text: { type: 'plain_text', text: '📊 Weekly CrUX Report' }
      },
      {
        type: 'section',
        fields: [
          {
            type: 'mrkdwn',
            text: `*LCP (p75):* ${metrics.largest_contentful_paint.percentiles.p75}ms`
          },
          {
            type: 'mrkdwn',
            text: `*FCP (p75):* ${metrics.first_contentful_paint.percentiles.p75}ms`
          },
          {
            type: 'mrkdwn',
            text: `*INP (p75):* ${metrics.interaction_to_next_paint.percentiles.p75}ms`
          },
          {
            type: 'mrkdwn',
            text: `*CLS (p75):* ${metrics.cumulative_layout_shift.percentiles.p75}`
          }
        ]
      },
      {
        type: 'context',
        elements: [
          {
            type: 'mrkdwn',
            text: `📱 Mobile data from real Chrome users | `
          }
        ]
      }
    ]
  };

  await fetch(SLACK_WEBHOOK, {
    method: 'POST',
    headers: { 'Content-Type': 'application/json' },
    body: JSON.stringify(message),
  });
}

// Run weekly via cron job or GitHub Actions
async function main() {
  const data = await getCruxData('https://your-site.com');
  await sendSlackReport(data);
}

main();
Set this up as a weekly cron job (GitHub Actions, Vercel Cron, or your CI/CD pipeline), and your team gets automatic visibility into real user performance. No manual checking, no forgetting to look at the data—it comes to you.
The REAL User Experience
Chances are you were watching reels on your phone before you landed here. For us tech folks, it's easy to quantify what works. For everyone else, they're drawn to the experience without exactly knowing what makes it work.
Real user monitoring tells you exactly the quality of work you're shipping. These metrics tell you how smooth your UI behaves, how snappy the interactions are, and how soon users are able to do what they came for.
The Real Score: User Delight
Stop optimizing for green checkmarks. Start optimizing for the user frantically tapping 'Buy Now' on a ₹8k phone with 2G in a Mumbai local. That's the score that matters.
It is important that your team has visibility into what matters: the users.
One Controversial Take
If your Lighthouse score is 100 but your p75 LCP is 5s in Bihar, you've failed.
Perfect scores are for portfolios. Shipping fast, snappy experiences is for promotions.
Your engineering manager doesn't care about your Lighthouse screenshot. They care about retention rates, conversion metrics, and user satisfaction scores. RUM data connects your technical work to these business outcomes.
What to Do Monday Morning
Ready to make the shift? Here's your action plan:
- Set up CRUX tracking for your domain (it's free and takes 5 minutes)
- Add basic RUM – even just web-vitals with console logging is a start
- Keep Lighthouse as a regression check, not a success metric
- Review RUM data weekly with your team and prioritize accordingly
- Share the data – make it visible to everyone (Slack channels, dashboards, etc.)
Remember: Your Lighthouse score is what you ship. Your RUM data is what users actually experience. Focus on the latter, and use the former to prevent backsliding.