No more on-call jitters
No more oncall jitters: Understanding Loki, Prometheus and grafana to understand your logging infrastructure
It’s 3 AM, and your phone buzzes—an alert for your frontend application is down. As a frontend dev on call, you log into Kubernetes, facing a flood of kubectl logs commands across scattered pods. Tracking that elusive API error feels like a treasure hunt with no map, compounded by the pressure to resolve it fast. You’re the one responsible for delivering answers to the team, often with incomplete data, adding to the stress of those late-night shifts.
While SSH access to nodes might theoretically help advanced users debug deeper issues, it’s rarely available to devs, leaving you reliant on cluster tools.
What if you had a streamlined system to centralize, search, and correlate those logs?
Why Logs Matter for Frontend Devs in Kubernetes
Logs are the unfiltered voice of your application—recording events, errors, and performance details that explain why your Next.js app is behaving unexpectedly. In Kubernetes, where pods scale and restart dynamically, logs help answer critical questions: "Why did this API request time out?" or "What's causing the hydration error in production?" They provide context for issues that metrics alone can't capture, such as stack traces or user session details.
For frontend devs on call, centralized logging is a game-changer. It eliminates the tedium of manually fetching logs from individual pods via kubectl logs, allowing quick searches across the cluster. This speeds up root cause analysis, reduces downtime, and integrates with dashboards for correlating logs with metrics (e.g., CPU spikes during a render loop). Tools like Loki and Promtail make this accessible, focusing on efficiency without the overhead of traditional systems.
The Design Principles Behind Loki, Promtail, and Grafana
To appreciate these tools, let's examine their foundational principles and architecture.
Grafana Loki: Developed by Grafana Labs in 2018, Loki is a log aggregation system optimized for Kubernetes. Unlike full-text indexing tools that consume massive resources, Loki indexes only metadata labels (e.g., namespace="blog-website", app="monospaced") and stores logs as compressed, unlabeled chunks. This label-based approach, inspired by Prometheus, keeps storage costs low while enabling fast queries via LogQL—a query language similar to PromQL. Loki supports flexible modes like single binary for small setups, TSDB for time-series efficiency, and storage backends like filesystem for simplicity. It's built for scale, handling high-volume logs without the bloat, making it ideal for devs who need quick insights without complex infrastructure.
Promtail: As Loki's companion agent, Promtail is designed to scrape logs from Kubernetes nodes with minimal configuration. It runs as a DaemonSet, automatically discovering container log files and enriching them with Kubernetes metadata as labels. Promtail's pipeline stages allow parsing (e.g., JSON from Next.js logs) and filtering before pushing to Loki, ensuring only relevant data is sent. Its lightweight footprint means it doesn't burden your cluster, focusing on reliability for continuous log ingestion.
Grafana: Since its inception in 2014, Grafana has evolved into a powerful open-source platform for visualizing data. When integrated with Loki, it serves as the query interface, allowing LogQL searches and dashboard creation. Grafana's strength lies in unifying logs with metrics, enabling frontend devs to build panels that correlate app errors with cluster health.
These tools prioritize pragmatism: low resource usage, easy integration, and developer-friendly querying. Loki's label-centric design, for instance, avoids expensive indexing, letting you query vast logs affordably—perfect for on-call scenarios where speed matters.
How Next.js Apps Expose Logs (and How They're Scraped)
In a Kubernetes setup, your Next.js app generates logs through standard output (stdout) and standard error (stderr). For example, a console.error("API timeout in fetch") or an unhandled exception writes to these streams. The container runtime (e.g., containerd) captures them, storing files like /var/log/pods/blog-website_monospaced-xyz/0.log on the node.
Promtail scrapes these files automatically:
- Discovers log paths via Kubernetes API metadata.
- Adds labels (e.g.,
app="monospaced",namespace="blog-website") for filtering. - Parses logs (e.g., as JSON if your Next.js app uses structured logging) using pipeline stages.
- Pushes to Loki's API.
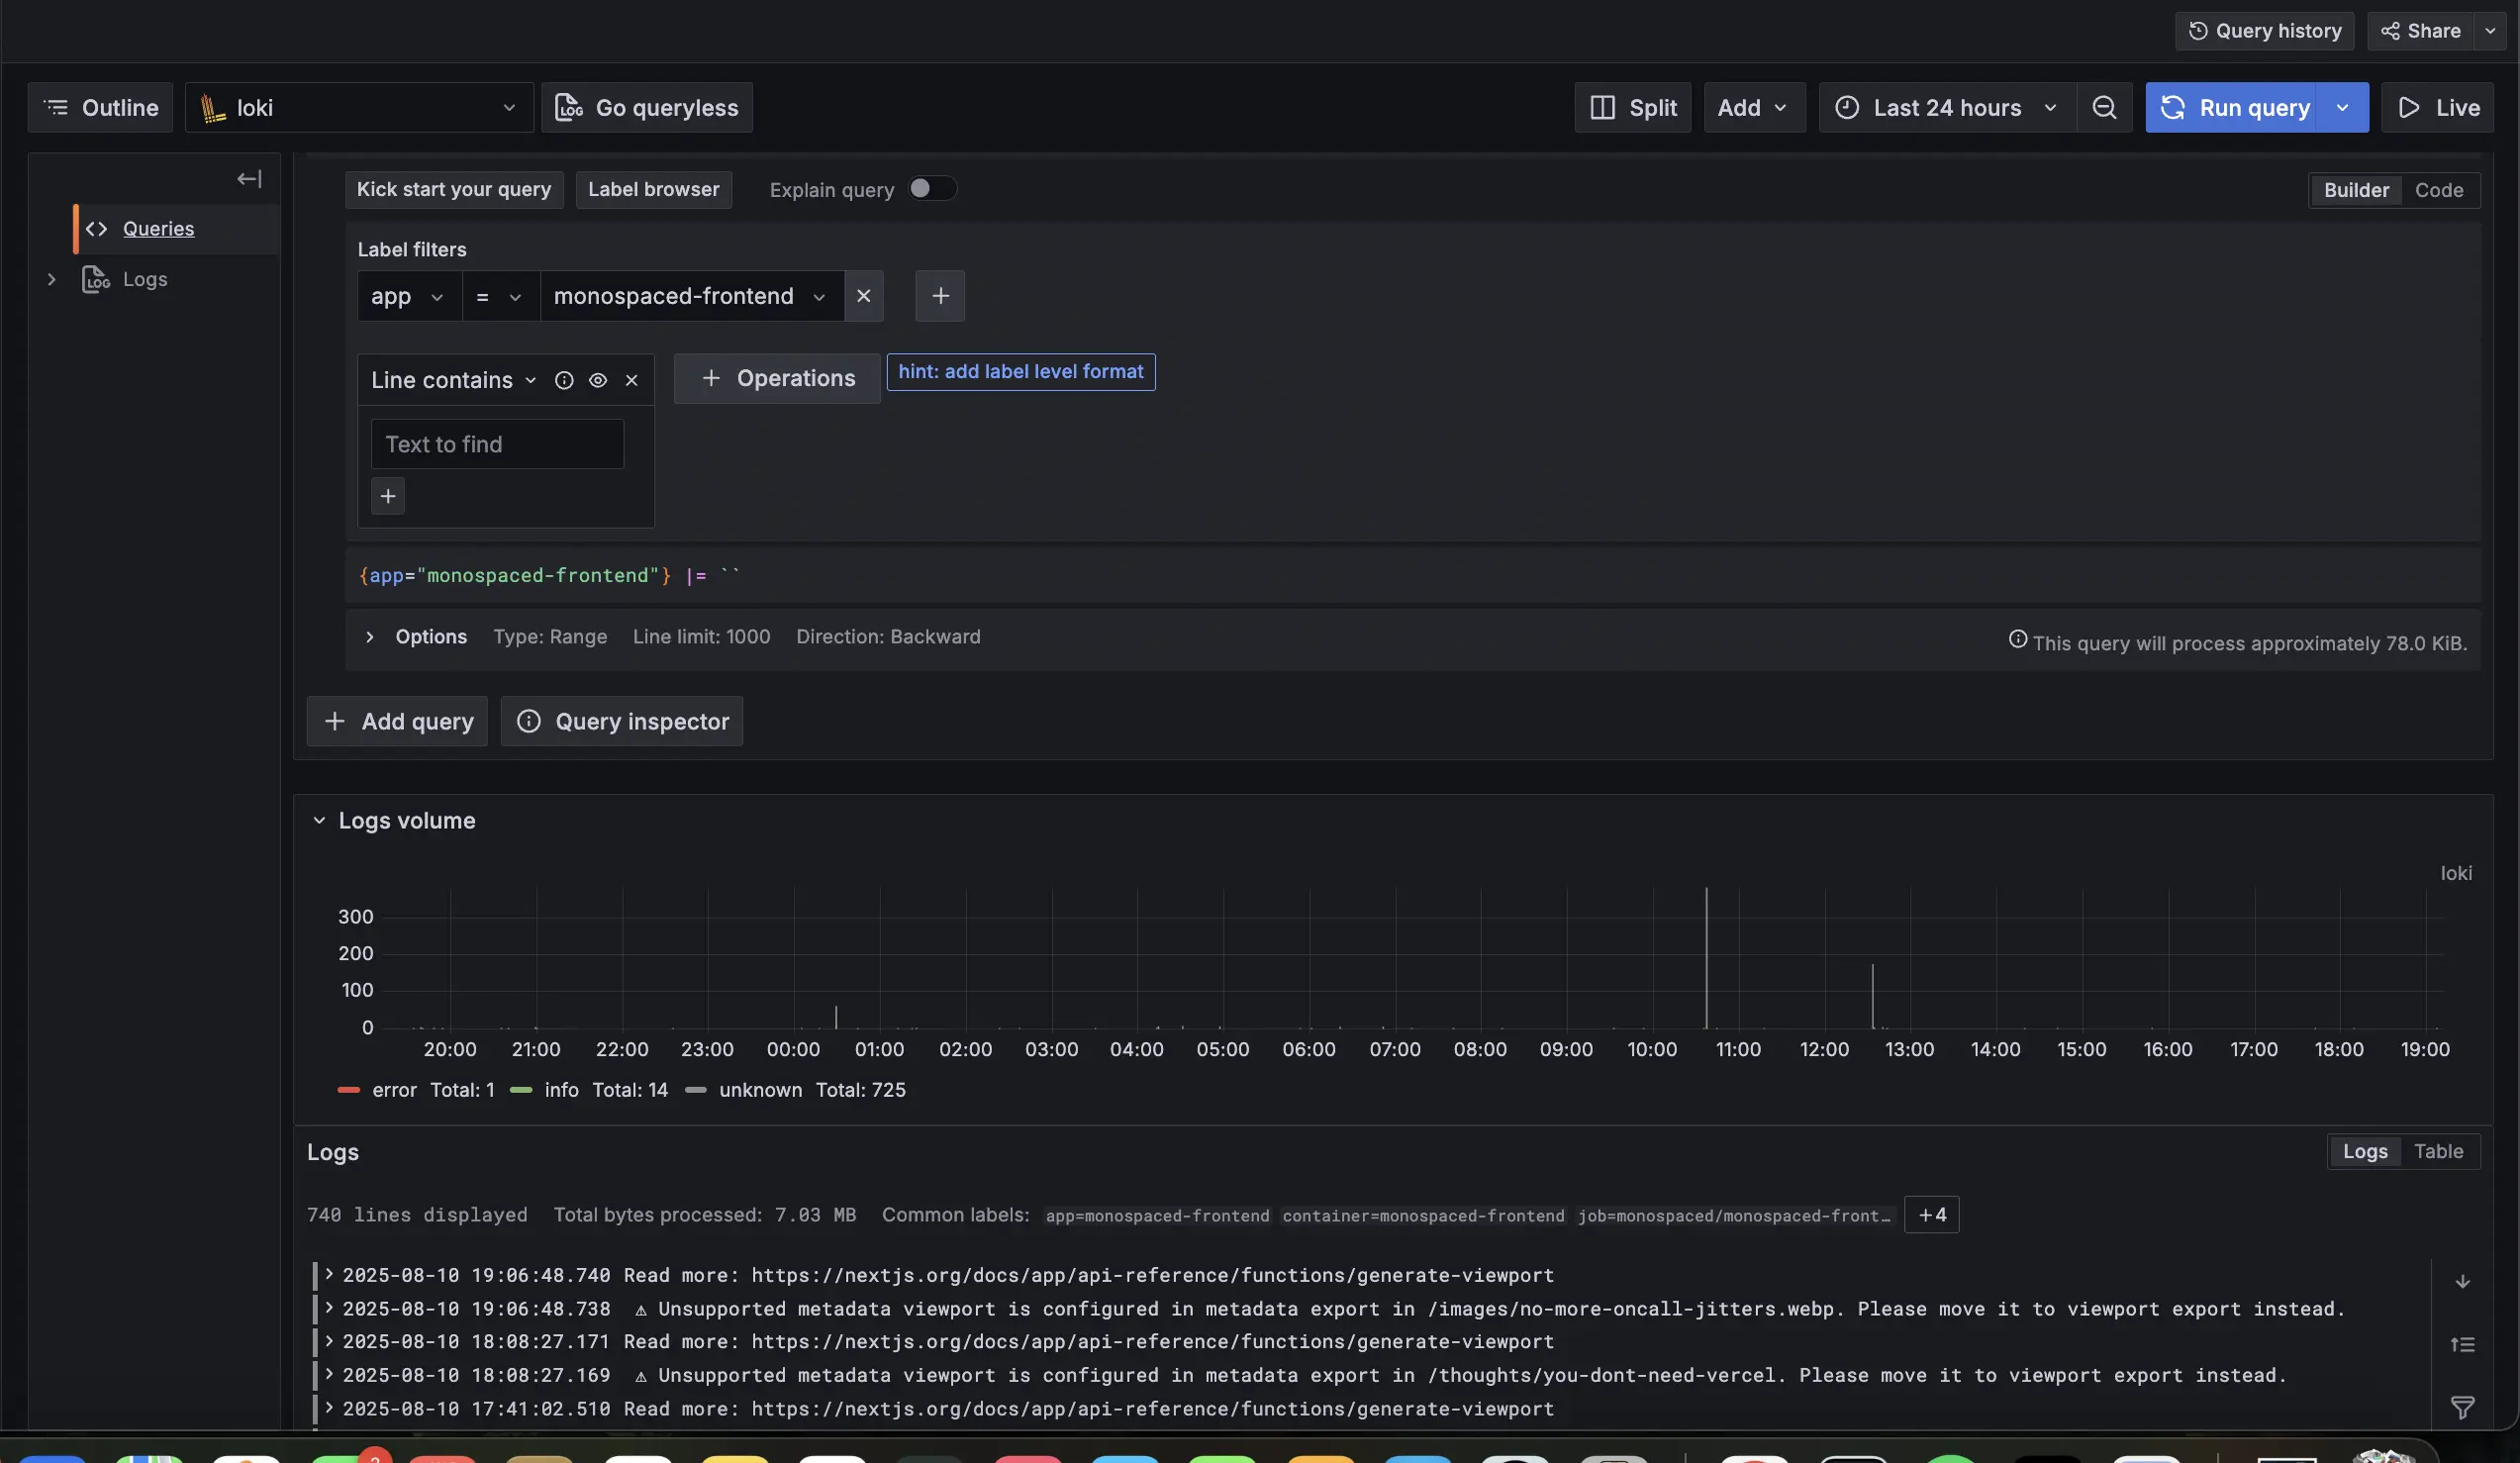
Loki handles indexing and storage efficiently: labels are indexed for quick searches, while log content is stored uncompressed in chunks (TSDB format) on filesystem. This means querying {app="monospaced"} |= "timeout" scans only relevant chunks, keeping things fast and storage-light—crucial for frontend devs sifting through render errors or API failures.
Integrating Loki and Promtail: Practical Tips for Frontend Devs
Let's build this logging solution pragmatically, focusing on a single binary Loki for simplicity in a K3s cluster with ArgoCD for deployment. These tips emphasize quick setup and on-call usability.
Tip 1: Deploy Loki with Essential Configs
Use the grafana/loki Helm chart in single binary mode. Key tips:
- Set TSDB schema for efficient querying.
- Use filesystem storage to keep things local.
- Define retention policies to manage space (e.g., 7 days).
- Apply resource constraints to fit your cluster.
Sample Helm values snippet:
deploymentMode: SingleBinary
loki:
  schemaConfig:
    configs:
      - from: 2025-08-01
        store: tsdb
        object_store: filesystem
        schema: v13
  storageConfig:
    filesystem:
      directory: /data/loki/chunks
  limits_config:
    retention_period: 7d
  resources:
    limits:
      cpu: 1
      memory: 2Gi
    requests:
      cpu: 500m
      memory: 1Gi
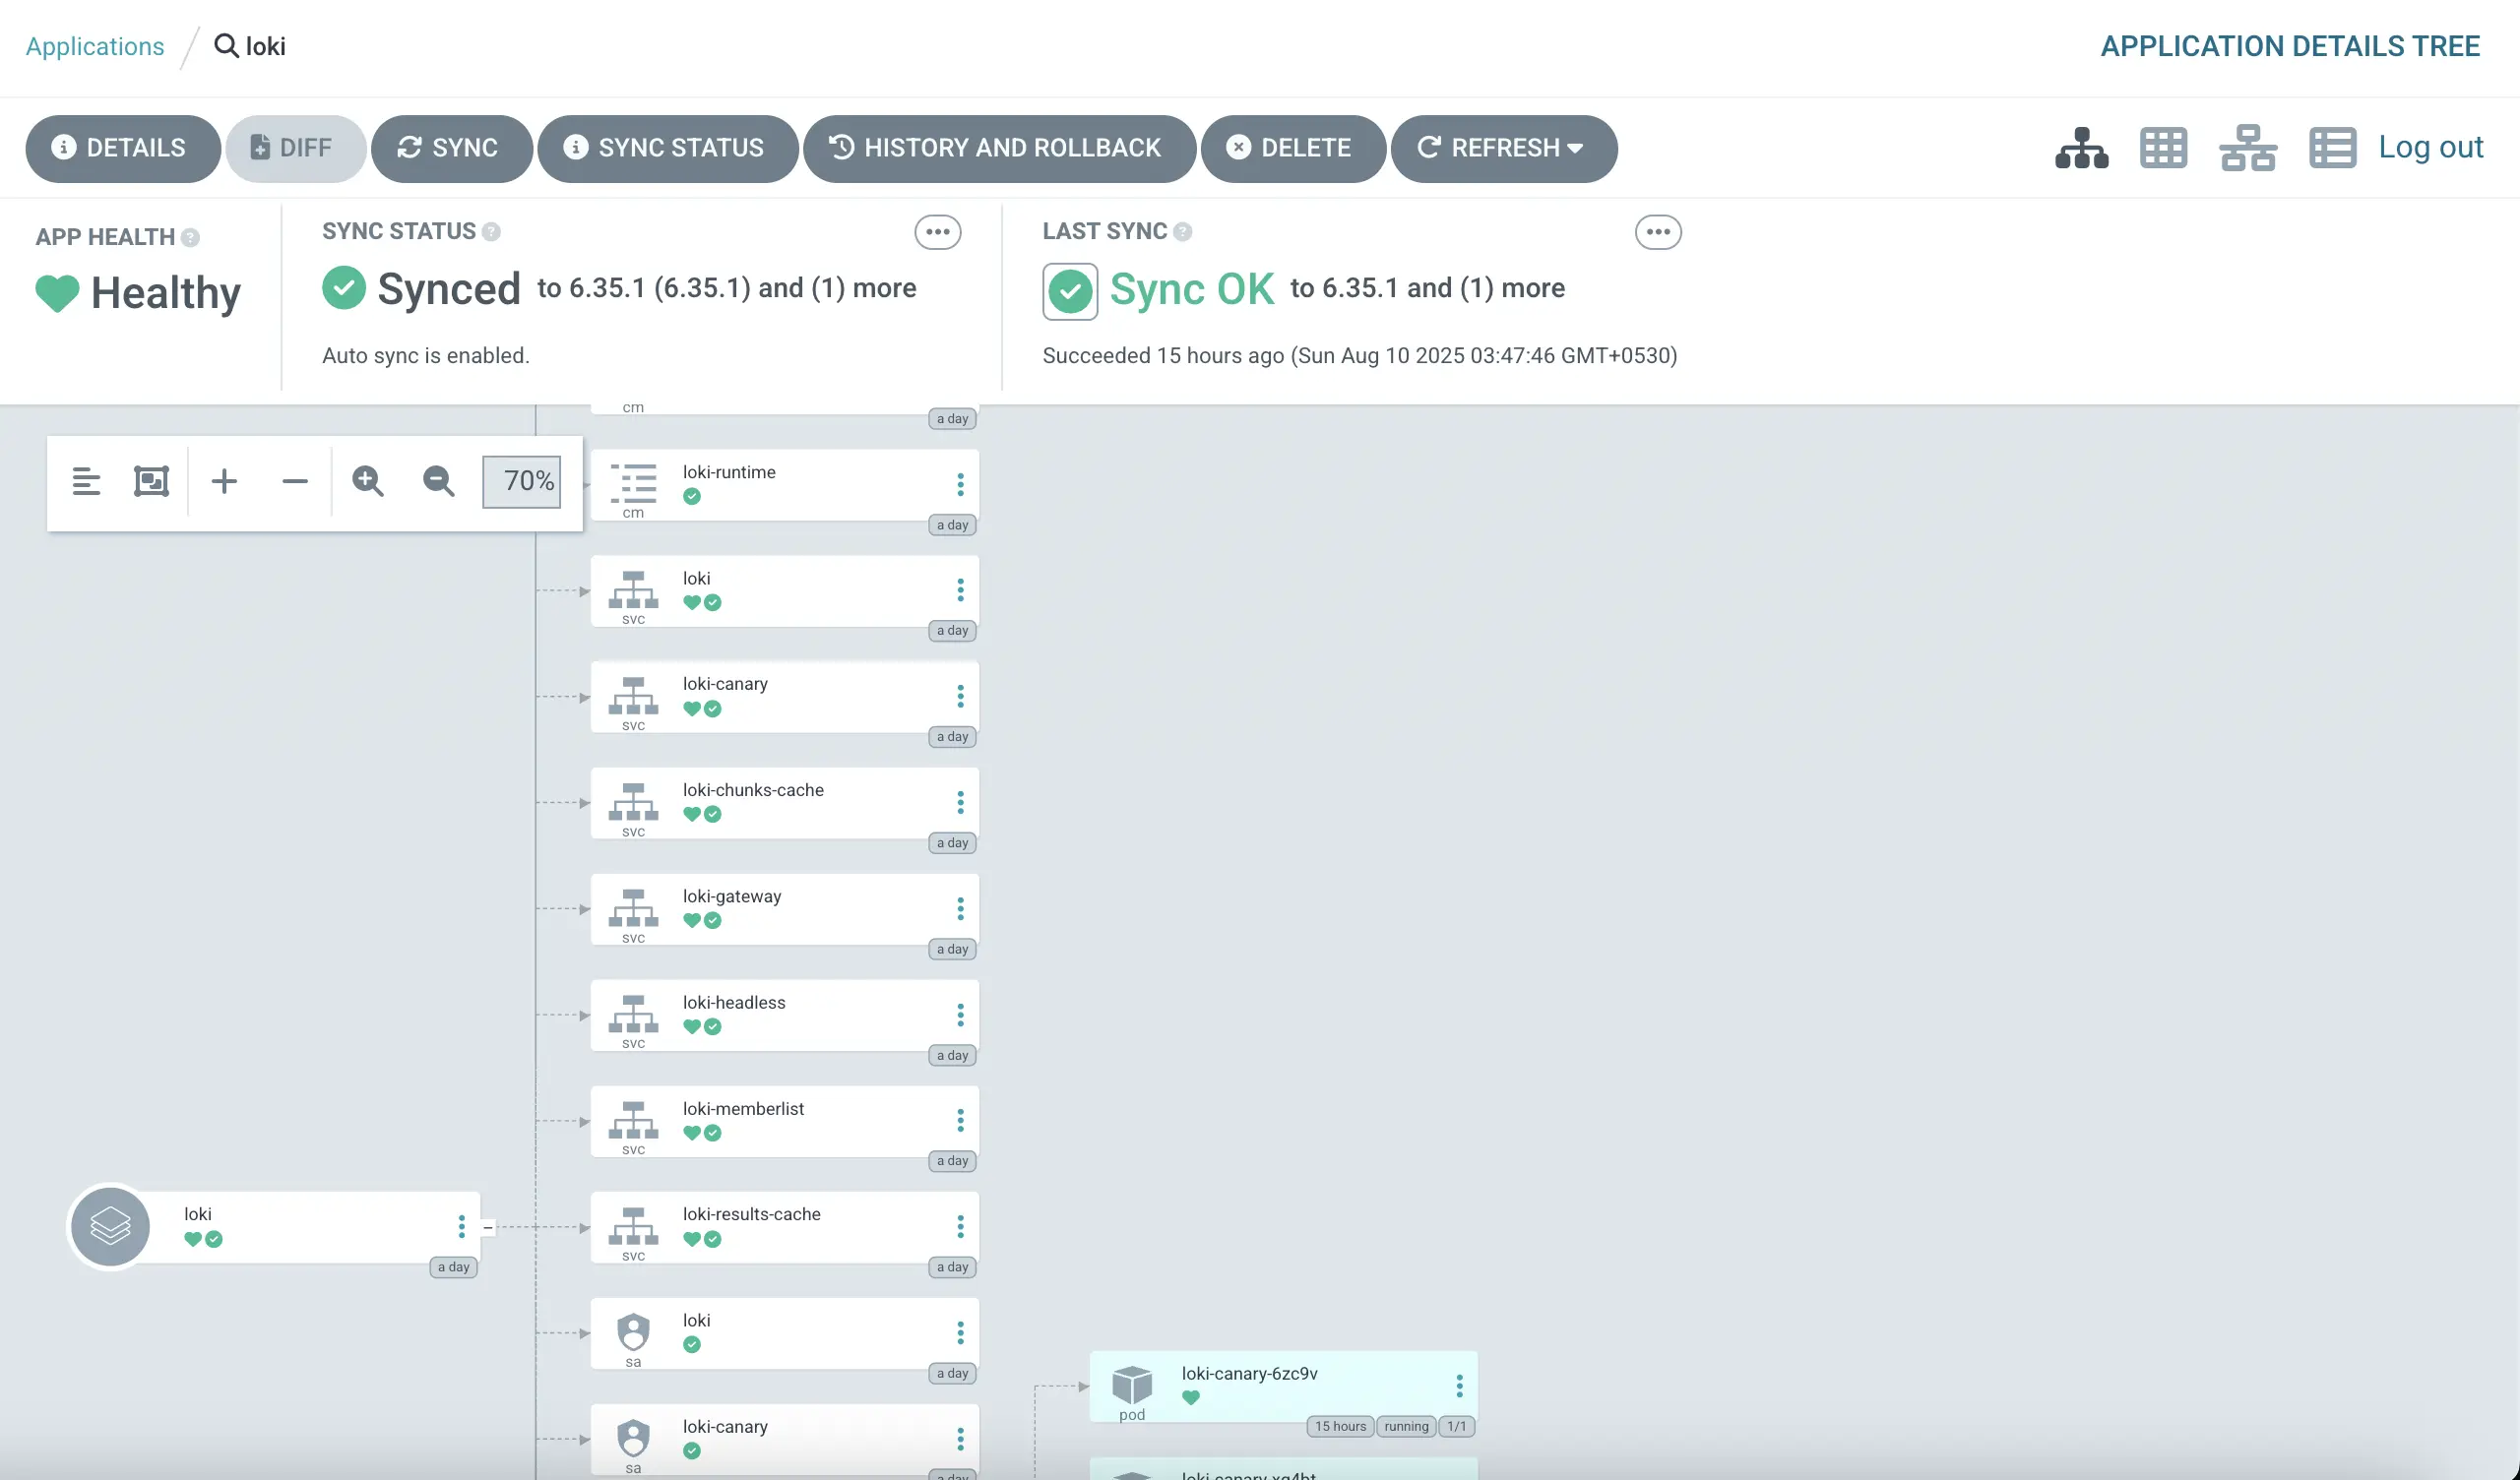
Deploy via ArgoCD by creating an Application pointing to the chart, syncing in the UI for validation.
Tip 2: Set Up Promtail for Cluster-Wide Scraping
Deploy the grafana/promtail Helm chart as a DaemonSet.
Tip: Point clients to Loki's service and add basic pipeline stages for parsing.
Sample values snippet:
config:
  clients:
    - url: http://loki.logging.svc.cluster.local:3100/loki/api/v1/push
  snippets:
    pipelineStages:
      - docker: {}
      - static_labels:
          job: kubernetes-logs
Use ArgoCD for deployment, ensuring it runs in all namespaces for comprehensive coverage.
Tip 3: Connect to Grafana for Querying
Add Loki as a datasource in Grafana:
- Set URL to Loki's service.
- Use LogQL for queries like
{namespace="blog-website"} |= "error"to filter monospaced issues. - Tip: Create a dashboard panel for common frontend errors (e.g., fetch failures), correlating with metrics for holistic views.
Optimizations for On-Call Efficiency
To make this setup pragmatic:
Resource Tuning: Start with low limits and monitor usage—scale up if queries slow.
Retention: Shorten to 7 days for non-critical logs to save space.
Promtail Filtering: Drop verbose logs (e.g., debug level) with a stage: - drop: {expression: "debug"}.
Query Best Practices: Use precise labels (e.g., {app="monospaced"}) to speed searches; enable Loki caching for frequent on-call queries.
Storage Tip: Filesystem is easy, but watch PVC size—consider alerts in Grafana for disk thresholds.
These keep the system lean, ensuring fast log access during on-call.
Empowering Your On-Call Workflow
As a frontend dev, integrating Loki and Promtail has transformed how I handle Kubernetes logs for monospaced—from reactive scrambling to proactive insight. By understanding their design and setting up with these tips, you'll debug faster, reduce stress, and focus on what you love: building great apps. Loki isn't just a tool; it's a strategic ally in your on-call arsenal.
Try This: Set up Loki on a test cluster, query your Next.js app's logs, and build a Grafana panel for errors. Share how it changed your debugging flow in the comments—I'd love to hear your story!