Monitor your nginx web app with confidence: Nginx-Prometheus-Log-Exporter
Monitor your nginx web apps with ease - using a log exporter pipeline to expose metrics via prometheus
A few days ago, I noticed that my personal website, the one you’re reading this on, was crashing every few hours. The site was running in a pretty constrained environment, and memory and CPU are scarce when you are running a large number of workloads on the same machine.
This website could have been a static export at any time, but I was running it as a server-rendered app because I constantly use this site to experiment, test ideas, and break things. That flexibility came at a cost: the website was down for a good chunk of time.
Next.js can be memory-heavy, especially when you are running server-rendered workloads in constrained environments. I am sure many people running Next.js in production have had to debug memory spikes, restarts, or OOMKilled pods at some point. I will not go into the exact semantics of why that happens here. This was simply the moment when I decided to move my site to a static export.
That meant serving plain old HTML, CSS, and JavaScript through a web server. I picked NGINX. NGINX is simple, reliable, and the migration took less than 30 minutes with the help of Claude Code.
But I was in for a surprise.
In open-source NGINX, the built-in stub_status module only exposes basic connection and request counters. It does not provide URL-level latency, per-route throughput, or route-level error visibility.
NGINX calls this ngx_http_stub_status_module, and it exposes basic values like active connections, accepted/handled connections, total requests, and reading/writing/waiting connections. It is also not always built by default; it must be compiled with --with-http_stub_status_module.
This means you can know that NGINX is receiving requests, but you still do not get the kind of application-level visibility I wanted: per-URL traffic, per-status-code error rates, route-level latency, or dashboard-friendly breakdowns.
Although my memory usage with NGINX barely spiked beyond 10MB, this is about principle: observability is not optional. No metrics means no alerting, and no alerting means you may not know your site is down until someone tells you.
Since NGINX did not support my requirements out of the box, I had to look at how the community handles this problem. One interesting idea, which I also covered in my previous blog post about OpenTelemetry, is converting logs into metrics.
NGINX may not expose the exact metrics I wanted, but it does emit access logs for every request-response cycle. So the question became: what if we could convert those logs into Prometheus metrics?
That would mean using an exporter that can:
- Tail the access log file
- Keep track of read offsets
- Handle log rotations
- Parse each request log line
- Expose metrics through an HTTP server
- Allow Prometheus to scrape those metrics
Initially, I considered building this myself, but then I came across prometheus-nginxlog-exporter, which is built for this exact use case.
It is also super easy to get started with: run it as a sidecar container next to your application, tell it where to read the logs from using an HCL/YAML config file, and expose its /metrics endpoint to Prometheus.
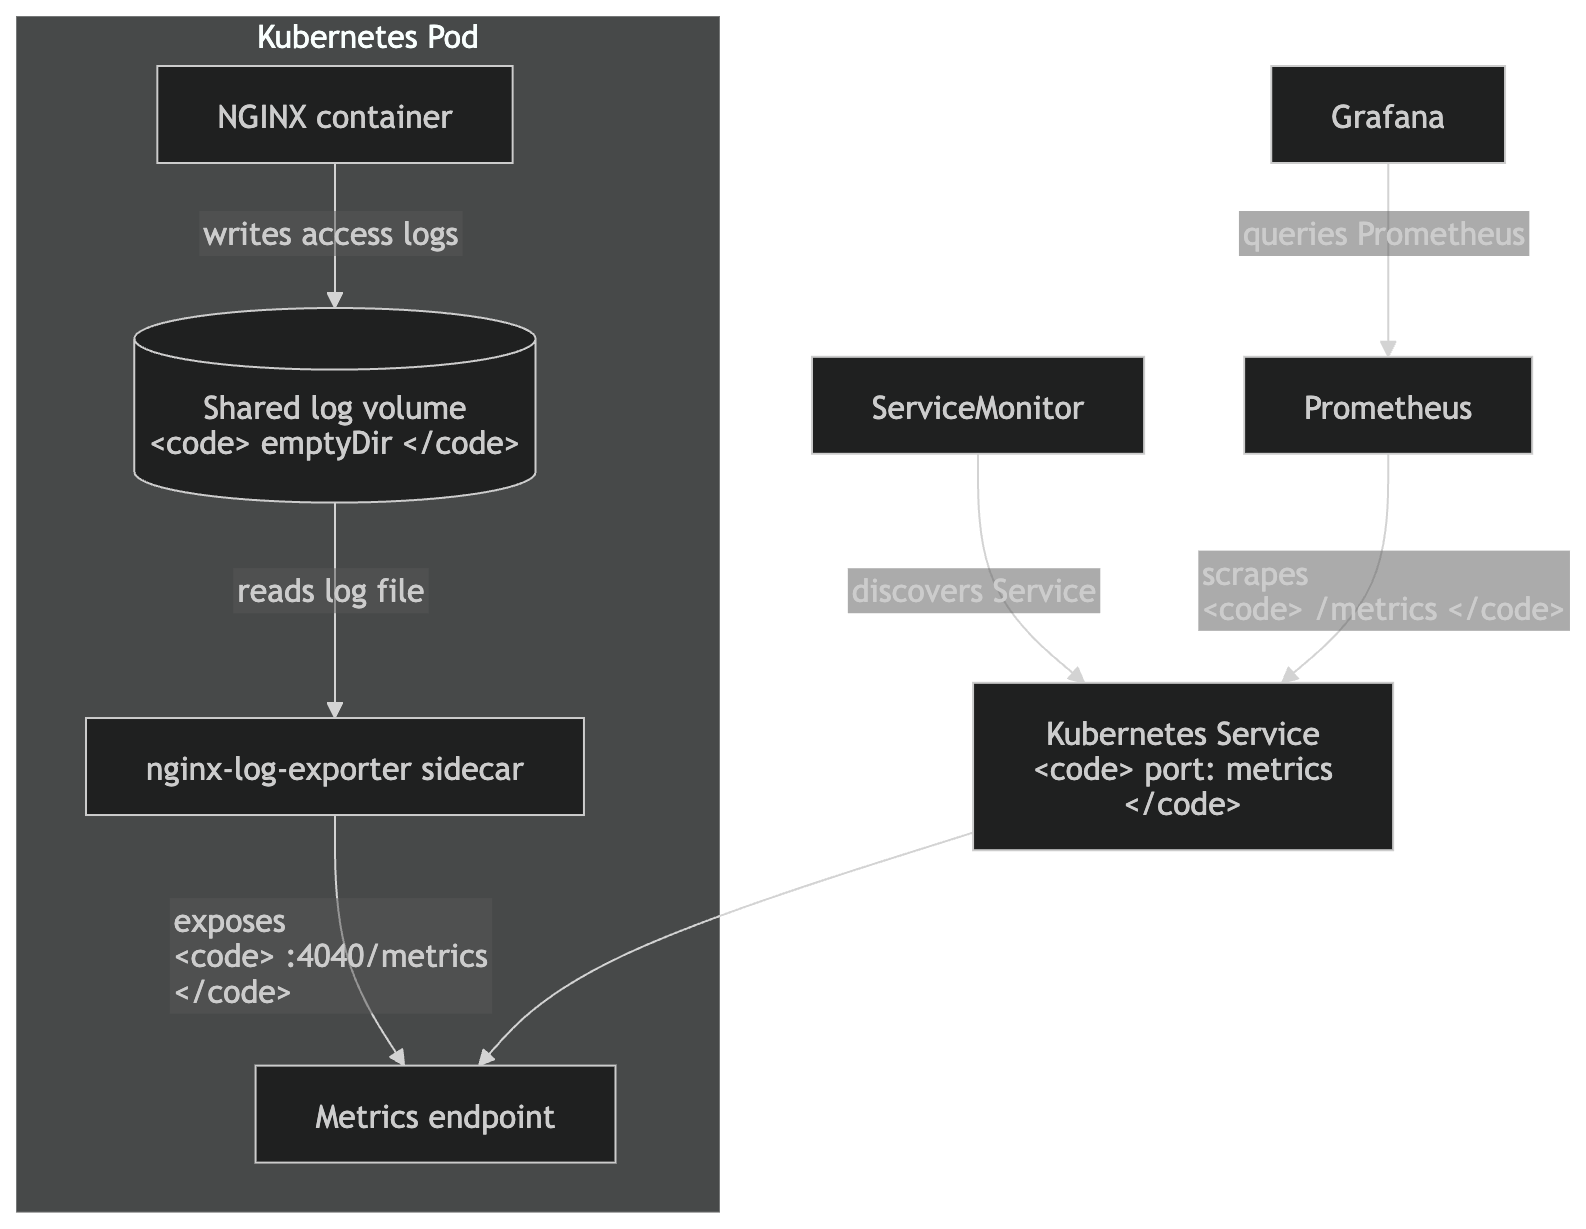
Architecture
The final setup is simple: the NGINX container writes access logs to a shared volume, the exporter sidecar reads those logs, exposes /metrics on port 4040, Prometheus discovers it through ServiceMonitor, and Grafana queries Prometheus for dashboards.
You do, however, have to instruct your NGINX server to emit logs in the format you need. I ended up using JSON because it is easier to parse and maintain.
log_format prometheus_json escape=json
'{'
    '"host":"$host",'
    '"method":"$request_method",'
    '"uri":"$uri",'
    '"status":$status,'
    '"request_time":$request_time,'
    '"bytes_sent":$bytes_sent,'
    '"request_length":$request_length'
'}';

access_log /var/log/nginx/exporter-access.log prometheus_json;
Once you are done setting up access logs from your server, the next step is to tell the exporter how to interpret the access log file. From the exporter docs, this is the configuration I ended up using:
apiVersion: v1
kind: ConfigMap
metadata:
  name: nginx-exporter-config
  namespace: monospaced
data:
  config.hcl: |
    listen {
      port = 4040
      address = "0.0.0.0"
    }

    namespace "nginx" {
      source {
        files = ["/var/log/nginx/exporter-access.log"]
      }
      parser = "json"

      labels {
        app = "monospaced-frontend"
      }

      relabel "host" {
        from = "host"
      }

      relabel "method" {
        from = "method"
      }

      relabel "uri" {
        from = "uri"
      }

      histogram_buckets = [0.005, 0.01, 0.025, 0.05, 0.1, 0.25, 0.5, 1, 2.5, 5, 10]
    }
Kubernetes wiring
Because the exporter runs as a sidecar, both the NGINX container and the exporter need access to the same log file. The simplest way to do this in Kubernetes is to use a shared volume.
volumes:
  - name: nginx-logs
    emptyDir: {}

containers:
  - name: nginx
    volumeMounts:
      - name: nginx-logs
        mountPath: /var/log/nginx

  - name: nginx-log-exporter
    ports:
      - name: metrics
        containerPort: 4040
    volumeMounts:
      - name: nginx-logs
        mountPath: /var/log/nginx
The exporter tails the NGINX access log, parses each request log line, and exposes the generated metrics on port 4040. Prometheus does not read the log file directly. Instead, it scrapes the exporter’s /metrics endpoint at the interval configured in the ServiceMonitor.
I created a ServiceMonitor resource, which tells Prometheus Operator how to discover and scrape the exporter:
apiVersion: monitoring.coreos.com/v1
kind: ServiceMonitor
metadata:
  name: monospaced-frontend
  namespace: monospaced
  labels:
    release: kube-prometheus-stack
spec:
  selector:
    matchLabels:
      app: monospaced-frontend
  endpoints:
    - port: metrics
      interval: 30s
      path: /metrics
      scheme: http
Be careful with uri as a label
This is the part where you have to be slightly careful.
relabel "uri" {
  from = "uri"
}
This is okay for my personal static site, but it can be dangerous in production if URLs contain IDs, slugs, UUIDs, search params, or user-generated paths. It can explode Prometheus cardinality.
Do not blindly expose raw URLs as Prometheus labels in high-traffic systems. Normalize them first. For example, /products/123 should become /products/:id; otherwise, every unique path can become a new time series.
The exporter supports dynamic relabeling and regex-based replacement for exactly this kind of normalization.
Example:
relabel "uri" {
  from = "uri"

  match "^/products/[0-9a-f-]+" {
    replacement = "/products/:id"
  }

  match "^/_next/static/.*" {
    replacement = "/_next/static/*"
  }
}
Once everything is wired up, the following metrics are available for usage:
nginx_http_request_size_bytes
nginx_http_response_count_total
nginx_http_response_time_seconds
nginx_http_response_time_seconds_count
nginx_http_response_time_seconds_hist_bucket
nginx_http_response_time_seconds_hist_count
nginx_http_response_time_seconds_hist_sum
nginx_http_response_time_seconds_sum
nginx_parse_errors_total
Moving ahead, the next step is to use these metrics to create dashboards and alerts. This is where I took my time to figure out what kind of visibility I would expect from a production system.
Having these metrics at my disposal, it was just a matter of wiring up some panels with PromQL. And voila, my own custom nginx-prometheus-log-exporter dashboard.
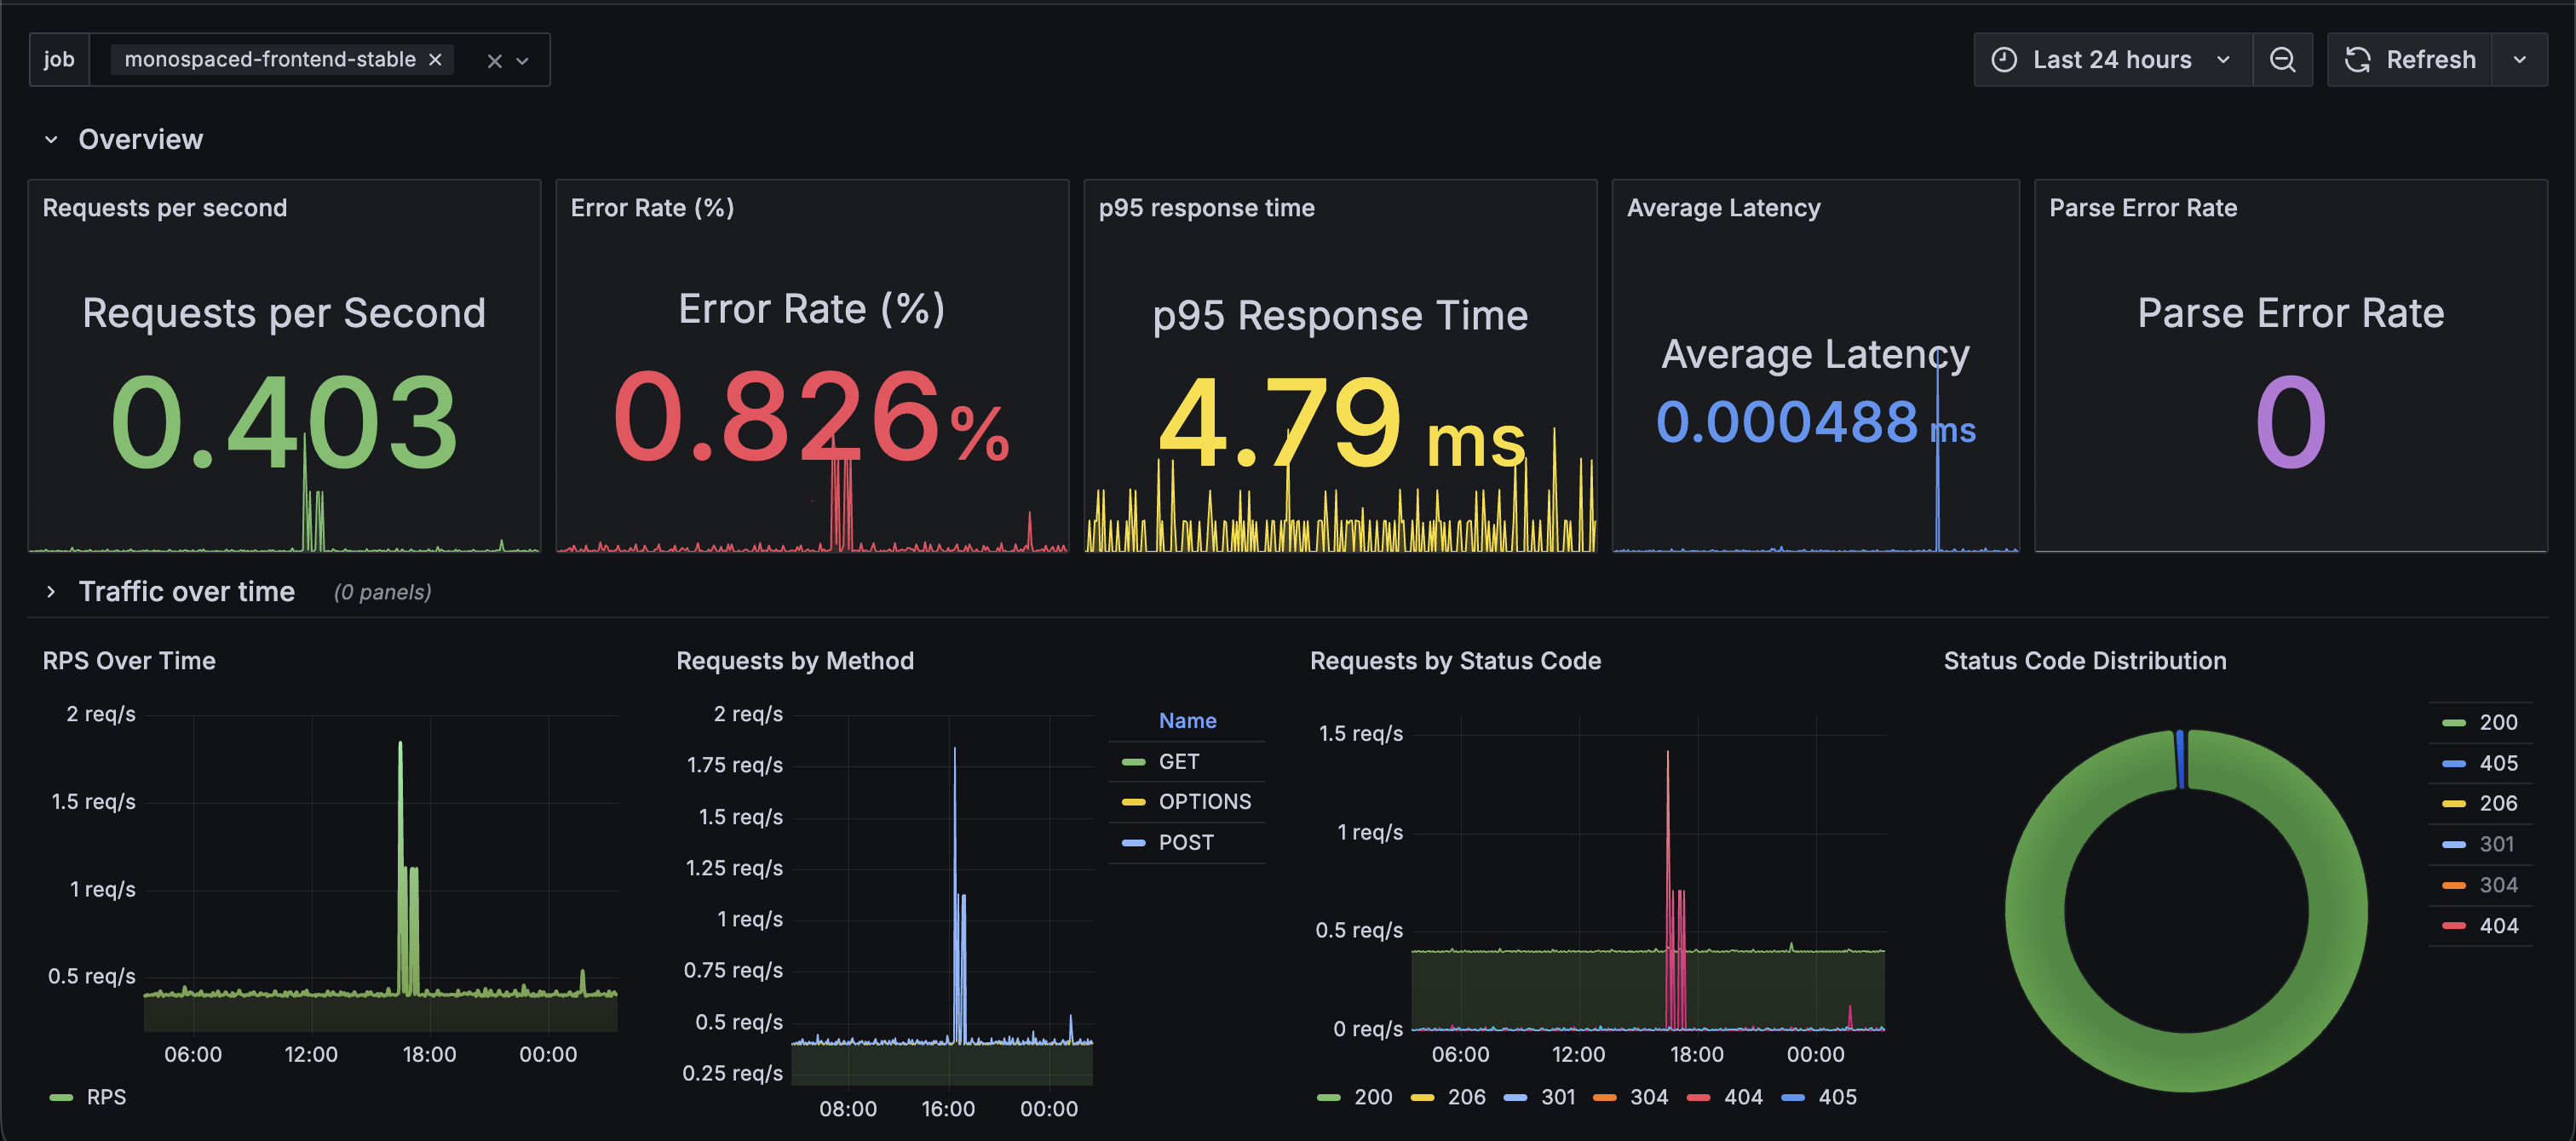
Some examples:
# Requests per second
sum(rate(nginx_http_response_count_total[$__rate_interval]))

# Error rate %
100 *
sum(rate(nginx_http_response_count_total{status=~"5.."}[$__rate_interval]))
/
sum(rate(nginx_http_response_count_total[$__rate_interval]))

# Top URLs by traffic
topk(10, sum by (uri) (
  rate(nginx_http_response_count_total[$__rate_interval])
))

# P95 latency
histogram_quantile(
  0.95,
  sum by (le) (
    rate(nginx_http_response_time_seconds_hist_bucket[$__rate_interval])
  )
)
Dashboard panels
The final dashboard is split into multiple rows so that each section answers a specific operational question.
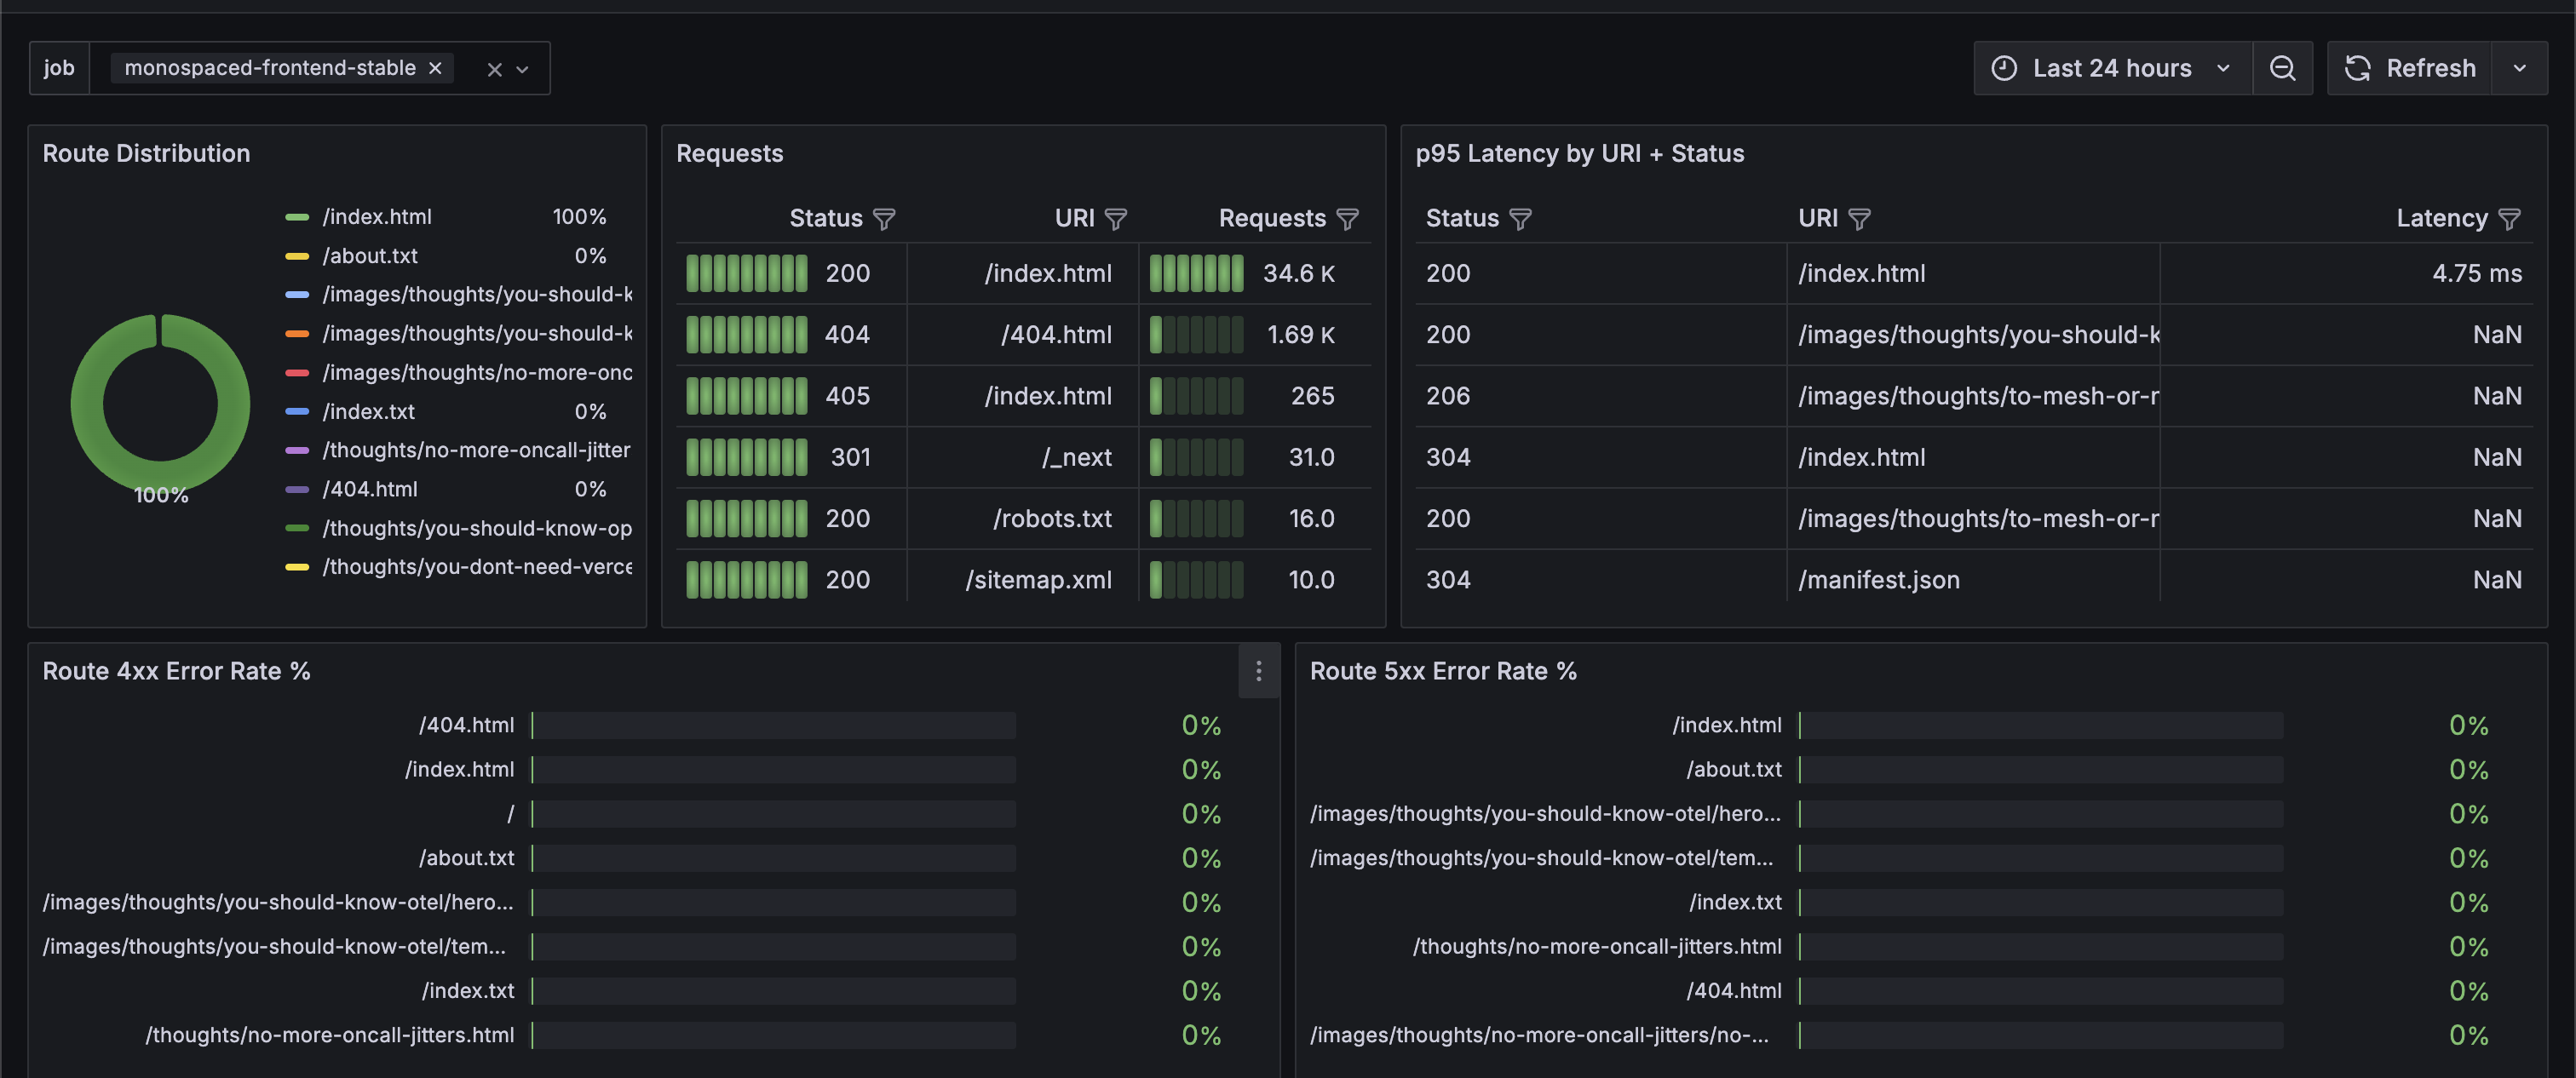
Route-level traffic and latency
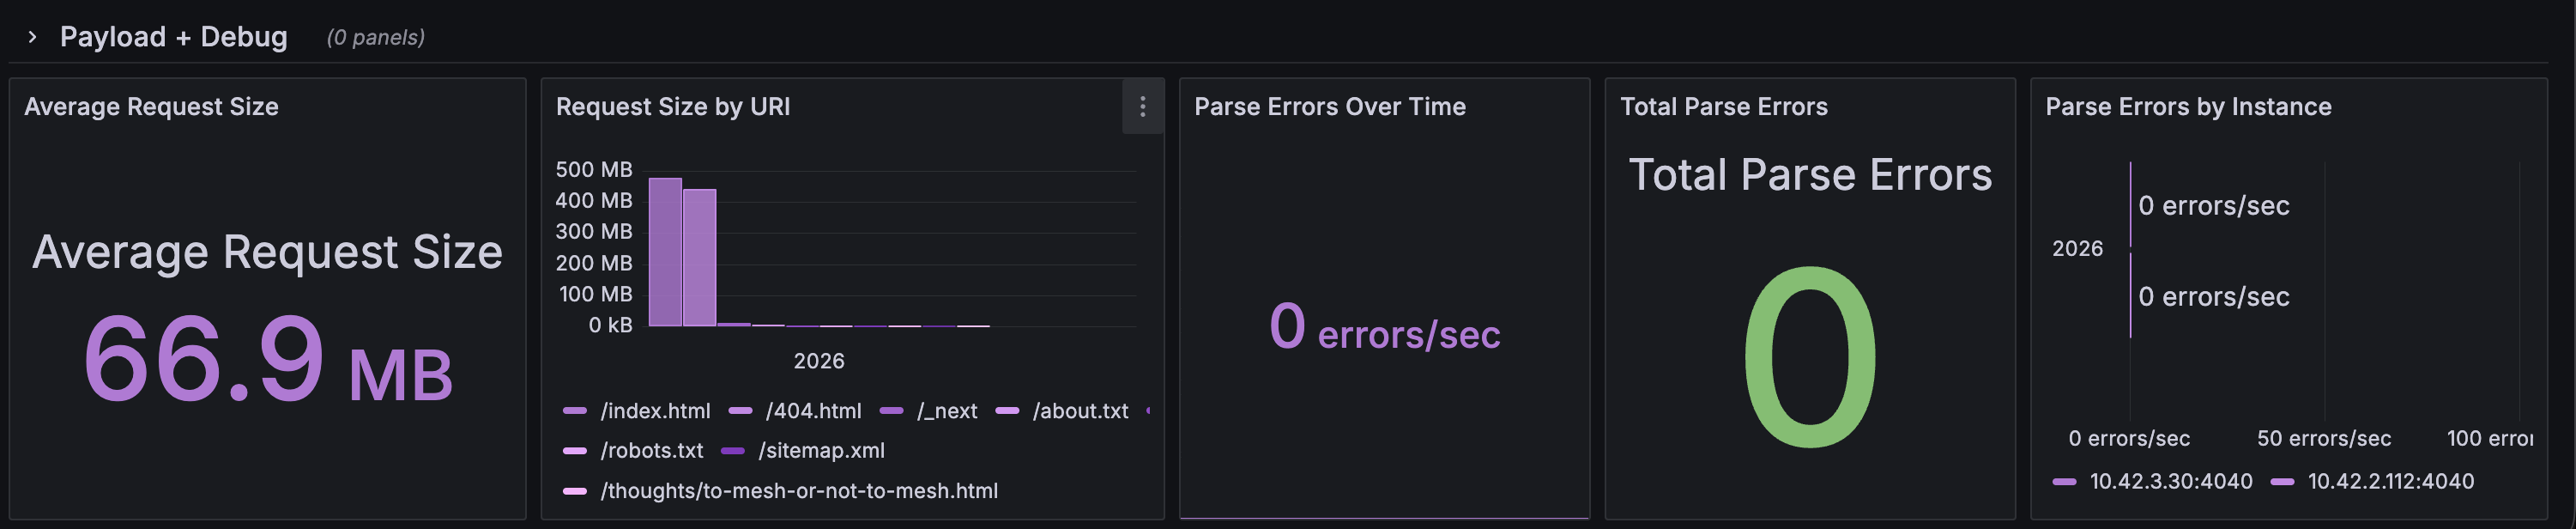
Error breakdowns
Latency and traffic panels
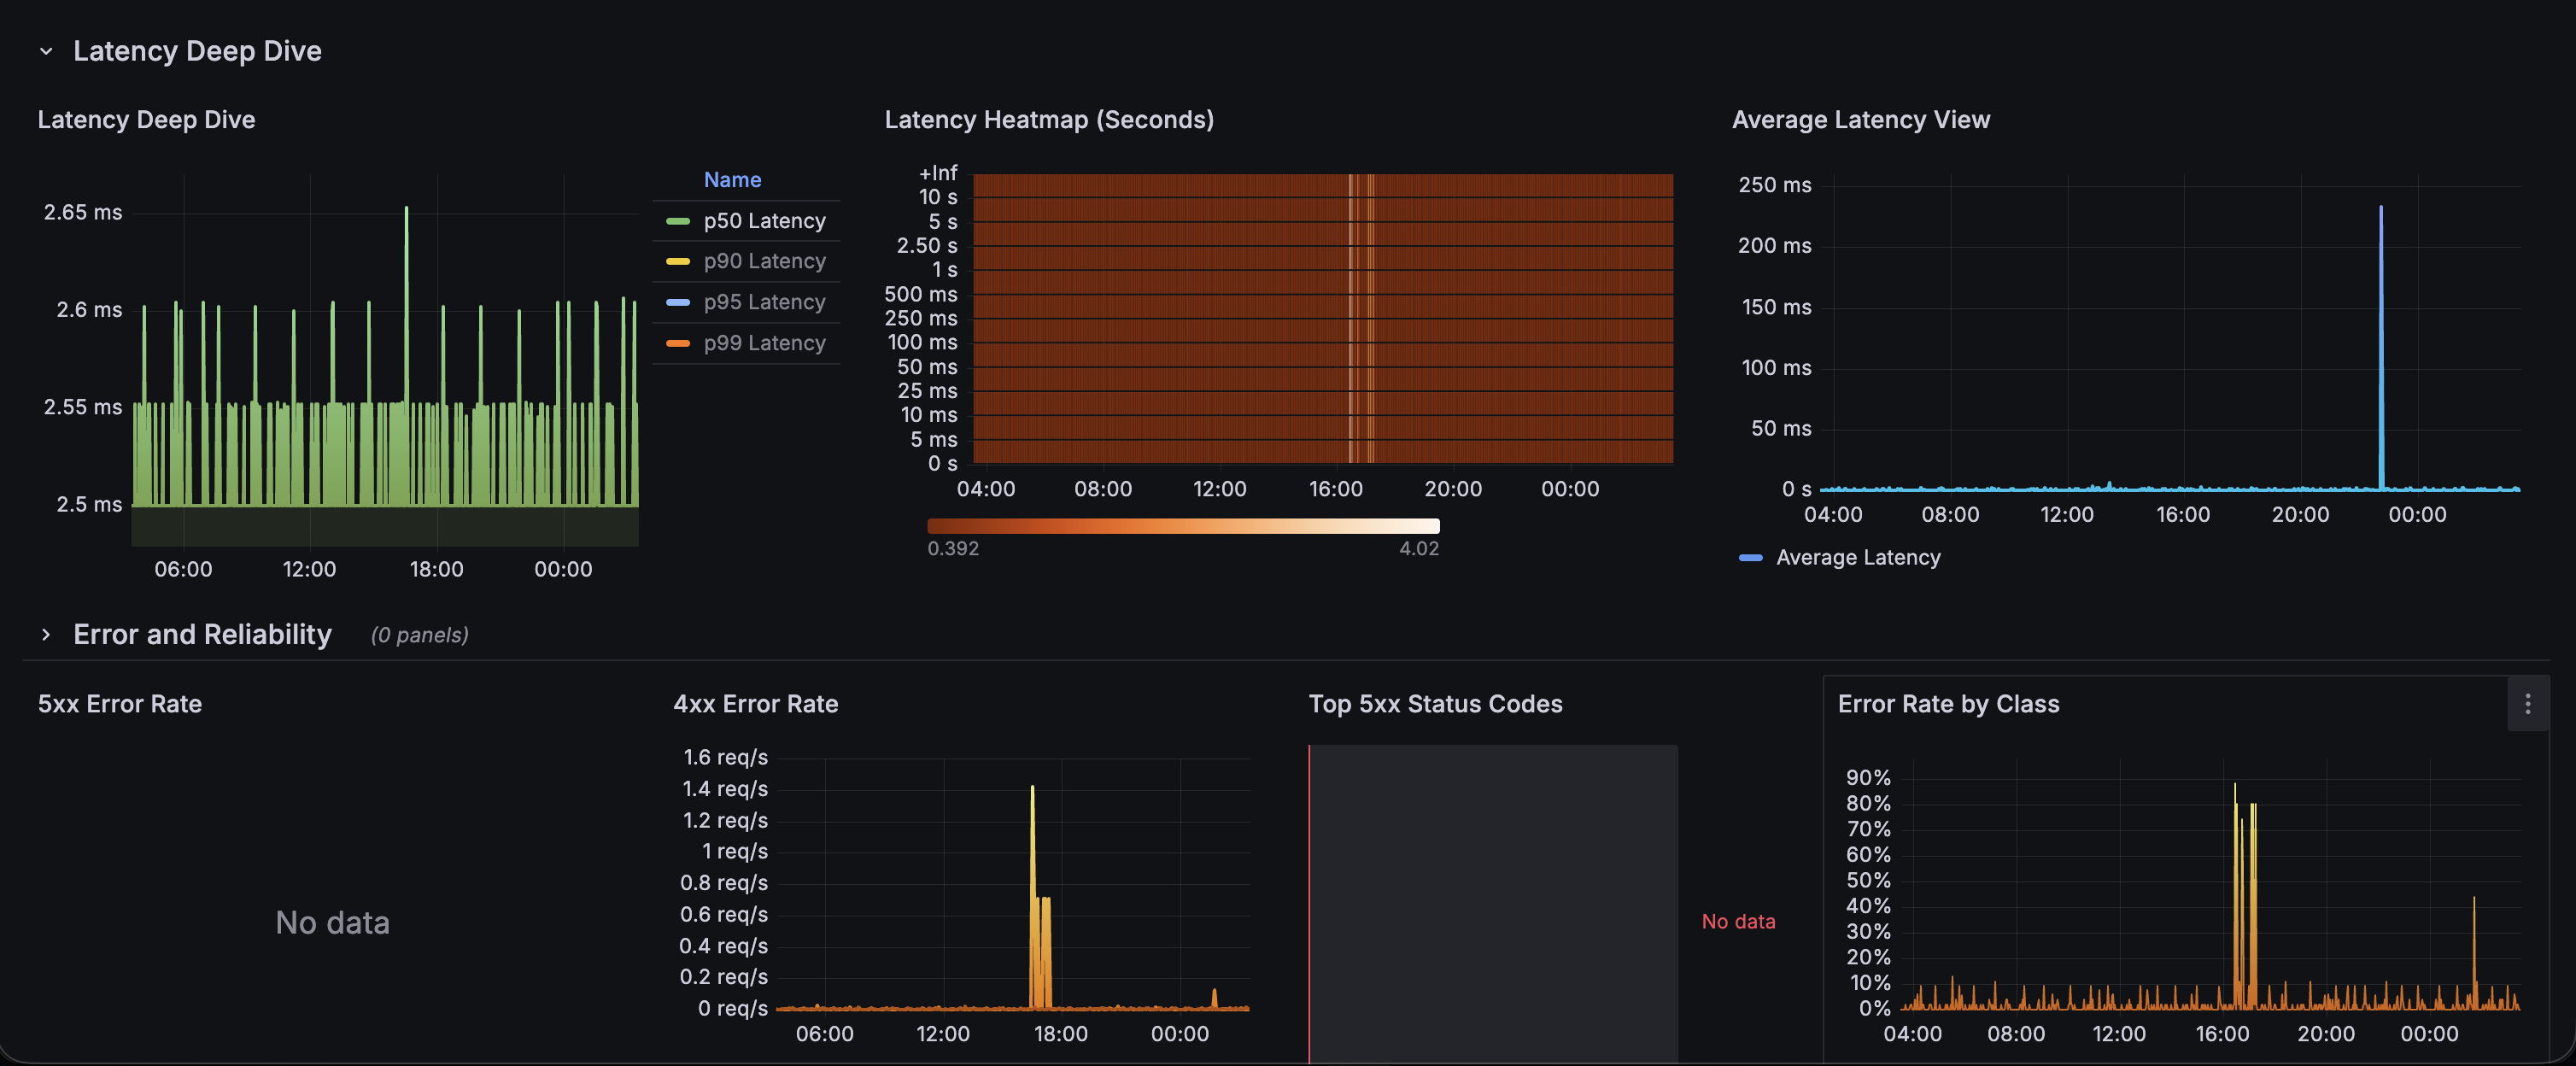
I published this dashboard on Grafana community dashboards. You can find it here.
Things to watch out for
- Raw URL labels can create high-cardinality metrics. Normalize routes before using them as labels.
- The exporter can only emit metrics for fields present in the access log.
- Always watch
nginx_parse_errors_total;if this increases, your parser or log format is broken. - Make sure log rotation does not break the exporter’s file tailing behavior.
- For Kubernetes, use a shared volume between the NGINX container and the exporter sidecar.
- The exporter is not a replacement for logs. It gives aggregate metrics; keep Loki, ELK, or another logging system if you need per-request debugging.
This setup is not a replacement for application instrumentation, distributed tracing, or structured logs. But for static sites, reverse proxies, and simple NGINX-backed workloads, it gives you a very useful baseline: traffic, errors, latency, request sizes, and enough signal to alert before users are the ones telling you that your site is broken.